| alerta | ||
| bin | ||
| contrib | ||
| doc | ||
| etc | ||
| tests | ||
| tools | ||
| .gitignore | ||
| .travis.yml | ||
| LICENSE | ||
| Makefile | ||
| MANIFEST.in | ||
| NOTICE | ||
| pylintrc | ||
| pypi.md | ||
| README.md | ||
| README.rst | ||
| requirements.txt | ||
| setup.py | ||
| tc-build.sh | ||
| VERSION | ||
Alerta Release 3.0
The alerta monitoring tool was developed with the following aims in mind:
- distributed and de-coupled so that it is SCALABLE
- minimal CONFIGURATION that easily accepts alerts from any source
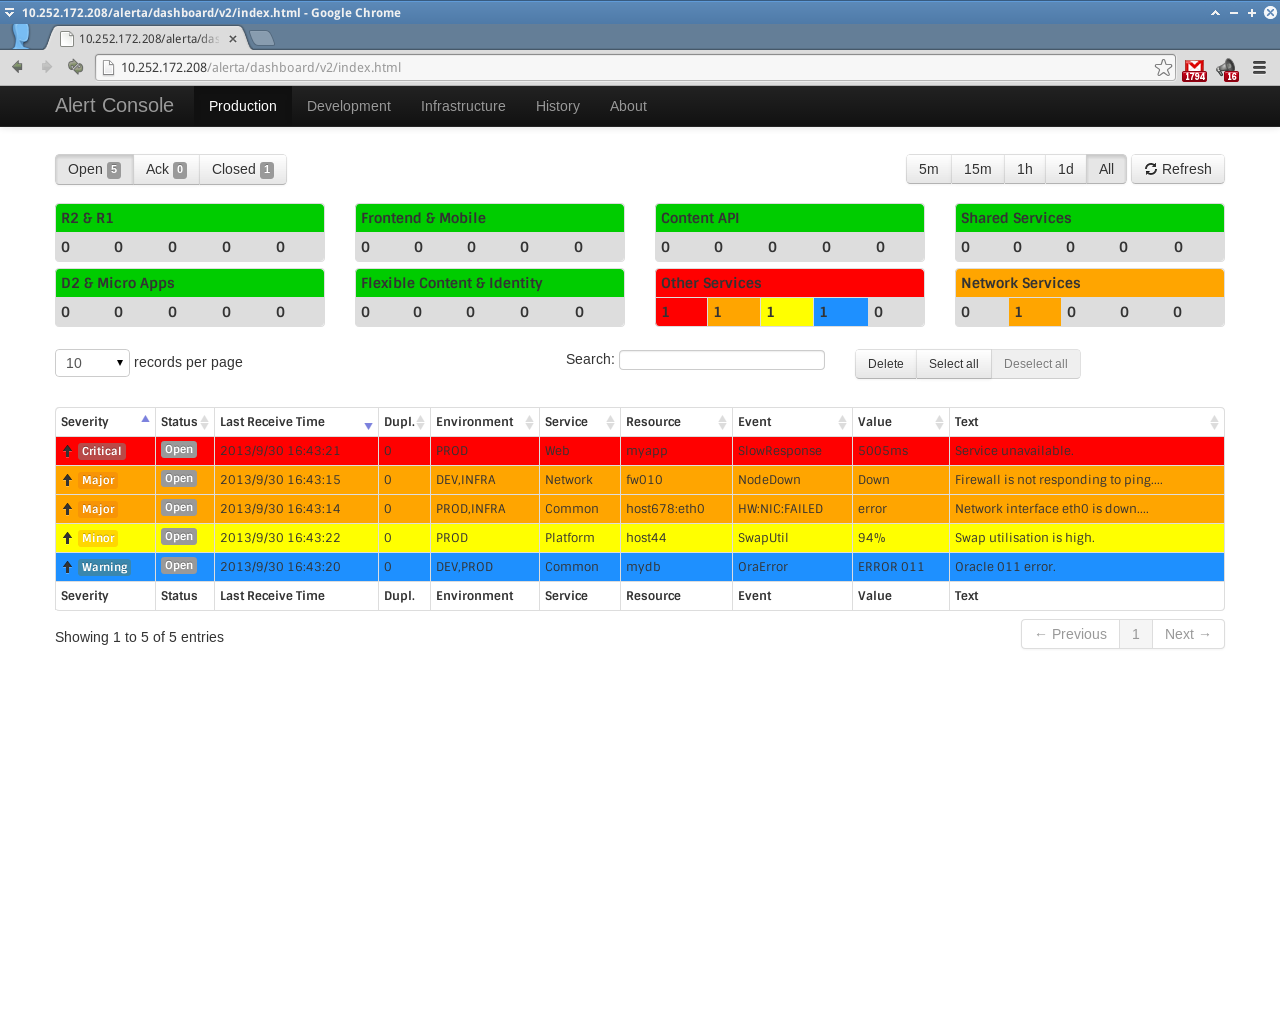
- quick at-a-glance VISUALISATION with drill-down to detail
More screenshots are available here
Related projects can be found [here][1].
Requirements
The only requirement is MongoDB. Everything else is optional.
- [MongoDB][4]
Optional
A messaging transport that supports AMQP is required for notification to alert subscribers. It is recommended to use RabbitMQ, but Redis and even MongoDB have been tested and shown to work. YMMV.
- [RabbitMQ][2]
- [Redis][3]
- [MongoDB][4]
Installation
To install and configure on Debian/Ubuntu:
$ sudo apt-get update
$ sudo apt-get install mongodb-server
To use RabbitMQ as the message transport:
$ sudo apt-get install rabbitmq-server
To use MongoDB as the message transport instead of RabbitMQ, add the following to
/etc/alerta/alerta.conf:
amqp_url = mongodb://localhost:27017/kombu
And to use Redis as the message transport:
amqp_url = redis://localhost:6379/
To install from git:
$ git clone https://github.com/guardian/alerta.git alerta
$ cd alerta
$ sudo pip install -r requirements.txt
$ sudo python setup.py install
To use the alert console modify $HOME/.alerta.conf so that the API uses a free port and static content can be found:
[DEFAULT]
endpoint = http://localhost:8080

[alerta-dashboard]
dashboard_dir = /path/to/alerta/dashboard/v2/assets/
For example, if the repo was cloned to /home/foobar/git/alerta then the dashboard_dir directory path will be /home/foobar/git/alerta/dashboard/v2/assets/.
To start alerta simply run:
$ alerta
To run in DEBUG mode and send log output to stderr:
$ alerta --debug --use-stderr
$ alerta-dashboard --debug --use-stderr          <--- listens on port 5000 in dev, 80 in prod
And then the alert console can be found at:
http://localhost:5000/dashboard/index.html
```

To see some test alerts in the console run:

```
$ contrib/examples/create-new-alert.sh
```

More Information
----------------

See the alerta [docs][7]. Feedback welcome.

Contribute
----------

If you'd like to hack on Alerta, start by forking this repo on GitHub.

http://github.com/guardian/alerta

License
-------

    Alerta monitoring system and console
    Copyright 2012 Guardian News & Media

    Licensed under the Apache License, Version 2.0 (the "License");
    you may not use this file except in compliance with the License.
    You may obtain a copy of the License at

        http://www.apache.org/licenses/LICENSE-2.0

    Unless required by applicable law or agreed to in writing, software
    distributed under the License is distributed on an "AS IS" BASIS,
    WITHOUT WARRANTIES OR CONDITIONS OF ANY KIND, either express or implied.
    See the License for the specific language governing permissions and
    limitations under the License.

[1]: <https://github.com/alerta/> "Alerta GitHub Repo"
[2]: <http://www.rabbitmq.com> "RabbitMQ"
[3]: <http://redis.io/> "Redis"
[4]: <https://www.mongodb.org/> "MongoDB"
[5]: <http://www.elasticsearch.org/> "elasticsearch"
[6]: <http://www.elasticsearch.org/overview/kibana/> "Kibana"
[7]: <http://docs.alerta.io/> "Alerta Documentation"

