* rrdset - in progress * rrdset optimal constructor; rrdset conflict * rrdset final touches * re-organization of rrdset object members * prevent use-after-free * dictionary dfe supports also counting of iterations * rrddim managed by dictionary * rrd.h cleanup * DICTIONARY_ITEM now is referencing actual dictionary items in the code * removed rrdset linked list * Revert "removed rrdset linked list" This reverts commit 690d6a588b4b99619c2c5e10f84e8f868ae6def5. * removed rrdset linked list * added comments * Switch chart uuid to static allocation in rrdset Remove unused functions * rrdset_archive() and friends... * always create rrdfamily * enable ml_free_dimension * rrddim_foreach done with dfe * most custom rrddim loops replaced with rrddim_foreach * removed accesses to rrddim->dimensions * removed locks that are no longer needed * rrdsetvar is now managed by the dictionary * set rrdset is rrdsetvar, fixes https://github.com/netdata/netdata/pull/13646#issuecomment-1242574853 * conflict callback of rrdsetvar now properly checks if it has to reset the variable * dictionary registered callbacks accept as first parameter the DICTIONARY_ITEM * dictionary dfe now uses internal counter to report; avoided excess variables defined with dfe * dictionary walkthrough callbacks get dictionary acquired items * dictionary reference counters that can be dupped from zero * added advanced functions for get and del * rrdvar managed by dictionaries * thread safety for rrdsetvar * faster rrdvar initialization * rrdvar string lengths should match in all add, del, get functions * rrdvar internals hidden from the rest of the world * rrdvar is now acquired throughout netdata * hide the internal structures of rrdsetvar * rrdsetvar is now acquired through out netdata * rrddimvar managed by dictionary; rrddimvar linked list removed; rrddimvar structures hidden from the rest of netdata * better error handling * dont create variables if not initialized for health * dont create variables if not initialized for health again * rrdfamily is now managed by dictionaries; references of it are acquired dictionary items * type checking on acquired objects * rrdcalc renaming of functions * type checking for rrdfamily_acquired * rrdcalc managed by dictionaries * rrdcalc double free fix * host rrdvars is always needed * attempt to fix deadlock 1 * attempt to fix deadlock 2 * Remove unused variable * attempt to fix deadlock 3 * snprintfz * rrdcalc index in rrdset fix * Stop storing active charts and computing chart hashes * Remove store active chart function * Remove compute chart hash function * Remove sql_store_chart_hash function * Remove store_active_dimension function * dictionary delayed destruction * formatting and cleanup * zero dictionary base on rrdsetvar * added internal error to log delayed destructions of dictionaries * typo in rrddimvar * added debugging info to dictionary * debug info * fix for rrdcalc keys being empty * remove forgotten unlock * remove deadlock * Switch to metadata version 5 and drop chart_hash chart_hash_map chart_active dimension_active v_chart_hash * SQL cosmetic changes * do not busy wait while destroying a referenced dictionary * remove deadlock * code cleanup; re-organization; * fast cleanup and flushing of dictionaries * number formatting fixes * do not delete configured alerts when archiving a chart * rrddim obsolete linked list management outside dictionaries * removed duplicate contexts call * fix crash when rrdfamily is not initialized * dont keep rrddimvar referenced * properly cleanup rrdvar * removed some locks * Do not attempt to cleanup chart_hash / chart_hash_map * rrdcalctemplate managed by dictionary * register callbacks on the right dictionary * removed some more locks * rrdcalc secondary index replaced with linked-list; rrdcalc labels updates are now executed by health thread * when looking up for an alarm look using both chart id and chart name * host initialization a bit more modular * init rrdlabels on host update * preparation for dictionary views * improved comment * unused variables without internal checks * service threads isolation and worker info * more worker info in service thread * thread cancelability debugging with internal checks * strings data races addressed; fixes https://github.com/netdata/netdata/issues/13647 * dictionary modularization * Remove unused SQL statement definition * unit-tested thread safety of dictionaries; removed data race conditions on dictionaries and strings; dictionaries now can detect if the caller is holds a write lock and automatically all the calls become their unsafe versions; all direct calls to unsafe version is eliminated * remove worker_is_idle() from the exit of service functions, because we lose the lock time between loops * rewritten dictionary to have 2 separate locks, one for indexing and another for traversal * Update collectors/cgroups.plugin/sys_fs_cgroup.c Co-authored-by: Vladimir Kobal <vlad@prokk.net> * Update collectors/cgroups.plugin/sys_fs_cgroup.c Co-authored-by: Vladimir Kobal <vlad@prokk.net> * Update collectors/proc.plugin/proc_net_dev.c Co-authored-by: Vladimir Kobal <vlad@prokk.net> * fix memory leak in rrdset cache_dir * minor dictionary changes * dont use index locks in single threaded * obsolete dict option * rrddim options and flags separation; rrdset_done() optimization to keep array of reference pointers to rrddim; * fix jump on uninitialized value in dictionary; remove double free of cache_dir * addressed codacy findings * removed debugging code * use the private refcount on dictionaries * make dictionary item desctructors work on dictionary destruction; strictier control on dictionary API; proper cleanup sequence on rrddim; * more dictionary statistics * global statistics about dictionary operations, memory, items, callbacks * dictionary support for views - missing the public API * removed warning about unused parameter * chart and context name for cloud * chart and context name for cloud, again * dictionary statistics fixed; first implementation of dictionary views - not currently used * only the master can globally delete an item * context needs netdata prefix * fix context and chart it of spins * fix for host variables when health is not enabled * run garbage collector on item insert too * Fix info message; remove extra "using" * update dict unittest for new placement of garbage collector * we need RRDHOST->rrdvars for maintaining custom host variables * Health initialization needs the host->host_uuid * split STRING to its own files; no code changes other than that * initialize health unconditionally * unit tests do not pollute the global scope with their variables * Skip initialization when creating archived hosts on startup. When a child connects it will initialize properly Co-authored-by: Stelios Fragkakis <52996999+stelfrag@users.noreply.github.com> Co-authored-by: Vladimir Kobal <vlad@prokk.net> |
||
|---|---|---|
| .. | ||
| asterisk.conf | ||
| asterisk.md | ||
| example.conf | ||
| k6.conf | ||
| k6.md | ||
| Makefile.am | ||
| README.md | ||
| statsd.c | ||
StatsD is a system to collect data from any application. Applications send metrics to it, usually via non-blocking UDP communication, and StatsD servers collect these metrics, perform a few simple calculations on them and push them to backend time-series databases.
If you want to learn more about the StatsD protocol, we have written a blog post about it!
Netdata is a fully featured statsd server. It can collect statsd formatted metrics, visualize them on its dashboards and store them in it's database for long-term retention.
Netdata statsd is inside Netdata (an internal plugin, running inside the Netdata daemon), it is configured via netdata.conf and by-default listens on standard statsd port 8125. Netdata supports both TCP and UDP packets at the same time.
Since statsd is embedded in Netdata, it means you now have a statsd server embedded on all your servers.
Netdata statsd is fast. It can collect several millions of metrics per second on modern hardware, using just 1 CPU core. The implementation uses two threads: one thread collects metrics, another thread updates the charts from the collected data.
Available StatsD synthetic application charts
Netdata ships with a few synthetic chart definitions to automatically present application metrics into a more uniform way. These synthetic charts are configuration files (you can create your own) that re-arrange statsd metrics into a more meaningful way.
On synthetic charts, we can have alarms as with any metric and chart.
- K6 load testing tool
- Description: k6 is a developer-centric, free and open-source load testing tool built for making performance testing a productive and enjoyable experience.
- Documentation
- Configuration
- Asterisk
- Description: Asterisk is an Open Source PBX and telephony toolkit.
- Documentation
- Configuration
Metrics supported by Netdata
Netdata fully supports the StatsD protocol and also extends it to support more advanced Netdata specific use cases. All StatsD client libraries can be used with Netdata too.
-
Gauges
The application sends
name:value|g, wherevalueis any decimal/fractional number, StatsD reports the latest value collected and the number of times it was updated (events).The application may increment or decrement a previous value, by setting the first character of the value to
+or-(so, the only way to set a gauge to an absolute negative value, is to first set it to zero).Sampling rate is supported. Tags are supported for changing chart units, family and dimension name.
When a gauge is not collected and the setting is not to show gaps on the charts (the default), the last value will be shown, until a data collection event changes it.
-
Counters and Meters
The application sends
name:value|c,name:value|Corname:value|m, wherevalueis a positive or negative integer number of events occurred, StatsD reports the rate and the number of times it was updated (events).:valuecan be omitted and StatsD will assume it is1.|c,|Cand|mcan be omitted and StatsD will assume it is|m. So, the application may send justnameand StatsD will parse it asname:1|m.- Counters use
|c(etsy/StatsD compatible) or|C(brubeck compatible) - Meters use
|m
Sampling rate is supported. Tags are supported for changing chart units, family and dimension name.
When a counter or meter is not collected, StatsD defaults to showing a zero value, until a data collection event changes the value.
- Counters use
-
Timers and Histograms
The application sends
name:value|msorname:value|h, wherevalueis any decimal/fractional number, StatsD reports min, max, average, 95th percentile, median and standard deviation and the total number of times it was updated (events). Internally it also calculates the sum, which is available for synthetic charts.- Timers use
|ms - Histograms use
|h
The only difference between the two, is the
unitsof the charts, as timers report milliseconds.Sampling rate is supported. Tags are supported for changing chart units and family.
When a counter or meter is not collected, StatsD defaults to showing a zero value, until a data collection event changes the value.
- Timers use
-
Sets
The application sends
name:value|s, wherevalueis anything (number or text, leading and trailing spaces are removed), StatsD reports the number of unique values sent and the number of times it was updated (events).Sampling rate is not supported for Sets.
valueis always considered text (so01and1are considered different).Tags are supported for changing chart units and family.
When a set is not collected, Netdata defaults to showing a zero value, until a data collection event changes the value.
-
Dictionaries
The application sends
name:value|d, wherevalueis anything (number or text, leading and trailing spaces are removed), StatsD reports the number of events sent for eachvalueand the total timesnamewas updated (events).Sampling rate is not supported for Dictionaries.
valueis always considered text (so01and1are considered different).Tags are supported for changing chart units and family.
When a set is not collected, Netdata defaults to showing a zero value, until a data collection event changes the value.
Sampling Rates
The application may append |@sampling_rate, where sampling_rate is a number from 0.0 to 1.0 in order for StatD to extrapolate the value and predict the total for the entire period. If the application reports to StatsD a value for 1/10th of the time, it can append |@0.1 to the metrics it sends to statsd.
Tags
The application may append |#tag1:value1,tag2:value2,tag3:value3 etc, where tagX and valueX are strings. :valueX can be omitted.
Currently, Netdata uses only 2 tags:
units=stringwhich sets the units of the chart that is automatically generatedfamily=stringwhich sets the family of the chart that is automatically generated (the family is the submenu of the dashboard)name=stringwhich sets the name of the dimension of the chart that is automatically generated (only for counters, meters, gauges)
Other tags are parsed, but currently are ignored.
Charts are not updated to change units or dimension names once they are created. So, either send the tags on every event, or use the special zinit value to initiaze the charts at the beginning. zinit is a special value that can be used on any chart, to have netdata initialize the charts, without actually setting any values to them. So, instead of sending my.metric:VALUE|c|#units=bytes,name=size every time, the application can send at the beginning my.metric:zinit|c|#units=bytes,name=size and then my.metric:VALUE|c.
Overlapping metrics
Netdata's StatsD server maintains different indexes for each of the metric types supported. This means the same metric name may exist under different types concurrently.
How to name your metrics
A good practice is to name your metrics like application.operation.metric, where:
applicationis the application name - Netdata will automatically create a dashboard section based on the first keyword of the metrics, so you can have all your applications in different sections.operationis the operation your application is executing, likedbquery,request,response, etc.metricis anything you want to name your metric as. Netdata will automatically append the metric type (meter, counter, gauge, set, dictionary, timer, histogram) to the generated chart.
Using Tags you can also change the submenus of the dashboard, the units of the charts and for meters, counters and gauges, the name of dimension. So, you can have a usable default view without using Synthetic StatsD charts
Multiple metrics per packet
Netdata accepts multiple metrics per packet if each is terminated with a newline (\n) at the end.
TCP packets
Netdata listens for both TCP and UDP packets. For TCP, is it important to always append \n on each metric, as Netdata will use the newline character to detect if a metric is split into multiple TCP packets.
UDP packets
When sending multiple metrics over a single UDP message, it is important not to exceed the network MTU, which is usually 1500 bytes.
Netdata will accept UDP packets up to 9000 bytes, but the underlying network will not exceed MTU.
You can read more about the network maximum transmission unit(MTU) in this cloudflare article.
Configuration
You can find the configuration at /etc/netdata/netdata.conf:
[statsd]
	# enabled = yes
	# decimal detail = 1000
	# update every (flushInterval) = 1
	# udp messages to process at once = 10
	# create private charts for metrics matching = *
	# max private charts allowed = 200
	# max private charts hard limit = 1000
	# private charts memory mode = save
	# private charts history = 3996
	# histograms and timers percentile (percentThreshold) = 95.00000
	# add dimension for number of events received = no
	# gaps on gauges (deleteGauges) = no
	# gaps on counters (deleteCounters) = no
	# gaps on meters (deleteMeters) = no
	# gaps on sets (deleteSets) = no
	# gaps on histograms (deleteHistograms) = no
	# gaps on timers (deleteTimers) = no
	# listen backlog = 4096
	# default port = 8125
	# bind to = udp:localhost:8125 tcp:localhost:8125
StatsD main config options
-
enabled = yes|nocontrols if StatsD will be enabled for this Netdata. The default is enabled.
-
default port = 8125controls the default port StatsD will use if no port is defined in the following setting.
-
bind to = udp:localhost tcp:localhostis a space separated list of IPs and ports to listen to. The format is
PROTOCOL:IP:PORT- ifPORTis omitted, thedefault portwill be used. IfIPis IPv6, it needs to be enclosed in[].IPcan also be*(to listen on all IPs) or even a hostname. -
update every (flushInterval) = 1seconds, controls the frequency StatsD will push the collected metrics to Netdata charts. -
decimal detail = 1000controls the number of fractional digits in gauges and histograms. Netdata collects metrics using signed 64-bit integers and their fractional detail is controlled using multipliers and divisors. This setting is used to multiply all collected values to convert them to integers and is also set as the divisors, so that the final data will be a floating point number with this fractional detail (1000 = X.0 - X.999, 10000 = X.0 - X.9999, etc).
The rest of the settings are discussed below.
StatsD charts
Netdata can visualize StatsD collected metrics in 2 ways:
-
Each metric gets its own private chart. This is the default and does not require any configuration. You can adjust the default parameters.
-
Synthetic charts can be created, combining multiple metrics, independently of their metric types. For this type of charts, special configuration is required, to define the chart title, type, units, its dimensions, etc.
Private metric charts
Private charts are controlled with create private charts for metrics matching = *. This setting accepts a space-separated list of simple patterns. Netdata will create private charts for all metrics by default.
For example, to render charts for all myapp.* metrics, except myapp.*.badmetric, use:
create private charts for metrics matching = !myapp.*.badmetric myapp.*
You can specify Netdata StatsD to have a different memory mode than the rest of the Netdata Agent. You can read more about memory mode in the documentation.
The default behavior is to use the same settings as the rest of the Netdata Agent. If you wish to change them, edit the following settings:
private charts memory modeprivate charts history
Optimize private metric charts visualization and storage
If you have thousands of metrics, each with its own private chart, you may notice that your web browser becomes slow when you view the Netdata dashboard (this is a web browser issue we need to address at the Netdata UI). So, Netdata has a protection to stop creating charts when max private charts allowed = 200 (soft limit) is reached.
The metrics above this soft limit are still processed by Netdata, can be used in synthetic charts and will be available to be sent to backend time-series databases, up to max private charts hard limit = 1000. So, between 200 and 1000 charts, Netdata will still generate charts, but they will automatically be created with memory mode = none (Netdata will not maintain a database for them). These metrics will be sent to backend time series databases, if the backend configuration is set to as collected.
Metrics above the hard limit are still collected, but they can only be used in synthetic charts (once a metric is added to chart, it will be sent to backend servers too).
Example private charts (automatically generated without any configuration):
Counters
- Scope: count the events of something (e.g. number of file downloads)
- Format:
name:INTEGER|corname:INTEGER|Corname|c - StatsD increments the counter by the
INTEGERnumber supplied (positive, or negative).

Gauges
- Scope: report the value of something (e.g. cache memory used by the application server)
- Format:
name:FLOAT|g - StatsD remembers the last value supplied, and can increment or decrement the latest value if
FLOATbegins with+or-.

histograms
- Scope: statistics on a size of events (e.g. statistics on the sizes of files downloaded)
- Format:
name:FLOAT|h - StatsD maintains a list of all the values supplied and provides statistics on them.

The same chart with sum unselected, to show the detail of the dimensions supported:

Meters
This is identical to counter.
- Scope: count the events of something (e.g. number of file downloads)
- Format:
name:INTEGER|morname|mor justname - StatsD increments the counter by the
INTEGERnumber supplied (positive, or negative).

Sets
- Scope: count the unique occurrences of something (e.g. unique filenames downloaded, or unique users that downloaded files)
- Format:
name:TEXT|s - StatsD maintains a unique index of all values supplied, and reports the unique entries in it.

Timers
- Scope: statistics on the duration of events (e.g. statistics for the duration of file downloads)
- Format:
name:FLOAT|ms - StatsD maintains a list of all the values supplied and provides statistics on them.

Synthetic StatsD charts
Use synthetic charts to create dedicated sections on the dashboard to render your StatsD charts.
Synthetic charts are organized in
- application aka section in Netdata Dashboard.
- charts for each application aka family in Netdata Dashboard.
- StatsD metrics for each chart /aka charts and context Netdata Dashboard.
You can read more about how the Netdata Agent organizes information in the relevant documentation
For each application you need to create a .conf file in /etc/netdata/statsd.d.
For example, if you want to monitor the application myapp using StatsD and Netdata, create the file /etc/netdata/statsd.d/myapp.conf, with this content:
[app]
	name = myapp
	metrics = myapp.*
	private charts = no
	gaps when not collected = no
	history = 60
# 	memory mode = ram

[dictionary]
    m1 = metric1
    m2 = metric2

# replace 'mychart' with the chart id
# the chart will be named: myapp.mychart
[mychart]
	name = mychart
	title = my chart title
	family = my family
	context = chart.context
	units = tests/s
	priority = 91000
	type = area
	dimension = myapp.metric1 m1
	dimension = myapp.metric2 m2
Using the above configuration myapp should get its own section on the dashboard, having one chart with 2 dimensions.
[app] starts a new application definition. The supported settings in this section are:
-
namedefines the name of the app. -
metricsis a Netdata simple pattern. This pattern should match all the possible StatsD metrics that will be participating in the applicationmyapp. -
private charts = yes|no, enables or disables private charts for the metrics matched. -
gaps when not collected = yes|no, enables or disables gaps on the charts of the application in case that no metrics are collected. -
memory modesets the memory mode for all charts of the application. The default is the global default for Netdata (not the global default for StatsD private charts). We suggest not to use this (we have commented it out in the example) and let your app use the global default for Netdata, which is our dbengine. -
historysets the size of the round robin database for this application. The default is the global default for Netdata (not the global default for StatsD private charts). This is only relevant if you usememory mode = save. Read more on our [metrics storage(]/docs/store/change-metrics-storage.md) doc.
[dictionary] defines name-value associations. These are used to renaming metrics, when added to synthetic charts. Metric names are also defined at each dimension line. However, using the dictionary dimension names can be declared globally, for each app and is the only way to rename dimensions when using patterns. Of course the dictionary can be empty or missing.
Then, add any number of charts. Each chart should start with [id]. The chart will be called app_name.id. family controls the submenu on the dashboard. context controls the alarm templates. priority controls the ordering of the charts on the dashboard. The rest of the settings are informational.
Add any number of metrics to a chart, using dimension lines. These lines accept 5 space separated parameters:
- the metric name, as it is collected (it has to be matched by the
metrics =pattern of the app) - the dimension name, as it should be shown on the chart
- an optional selector (type) of the value to shown (see below)
- an optional multiplier
- an optional divider
- optional flags, space separated and enclosed in quotes. All the external plugins
DIMENSIONflags can be used. Currently the only usable flag ishidden, to add the dimension, but not show it on the dashboard. This is usually needed to have the values available for percentage calculation, or use them in alarms.
So, the format is this:
dimension = [pattern] METRIC NAME TYPE MULTIPLIER DIVIDER OPTIONS
pattern is a keyword. When set, METRIC is expected to be a Netdata simple pattern that will be used to match all the StatsD metrics to be added to the chart. So, pattern automatically matches any number of StatsD metrics, all of which will be added as separate chart dimensions.
TYPE, MULTIPLIER, DIVIDER and OPTIONS are optional.
TYPE can be:
eventsto show the number of events received by StatsD for this metriclastto show the last value, as calculated at the flush interval of the metric (the default)
Then for histograms and timers the following types are also supported:
min, show the minimum valuemax, show the maximum valuesum, show the sum of all valuesaverage(same aslast)percentile, show the 95th percentile (or any other percentile, as configured at StatsD global config)median, show the median of all values (i.e. sort all values and get the middle value)stddev, show the standard deviation of the values
Example synthetic charts
StatsD metrics: foo and bar.
Contents of file /etc/netdata/stats.d/foobar.conf:
[app]
  name = foobarapp
  metrics = foo bar
  private charts = yes

[foobar_chart1]
  title = Hey, foo and bar together
  family = foobar_family
  context = foobarapp.foobars
  units = foobars
  type = area
  dimension = foo 'foo me' last 1 1
  dimension = bar 'bar me' last 1 1
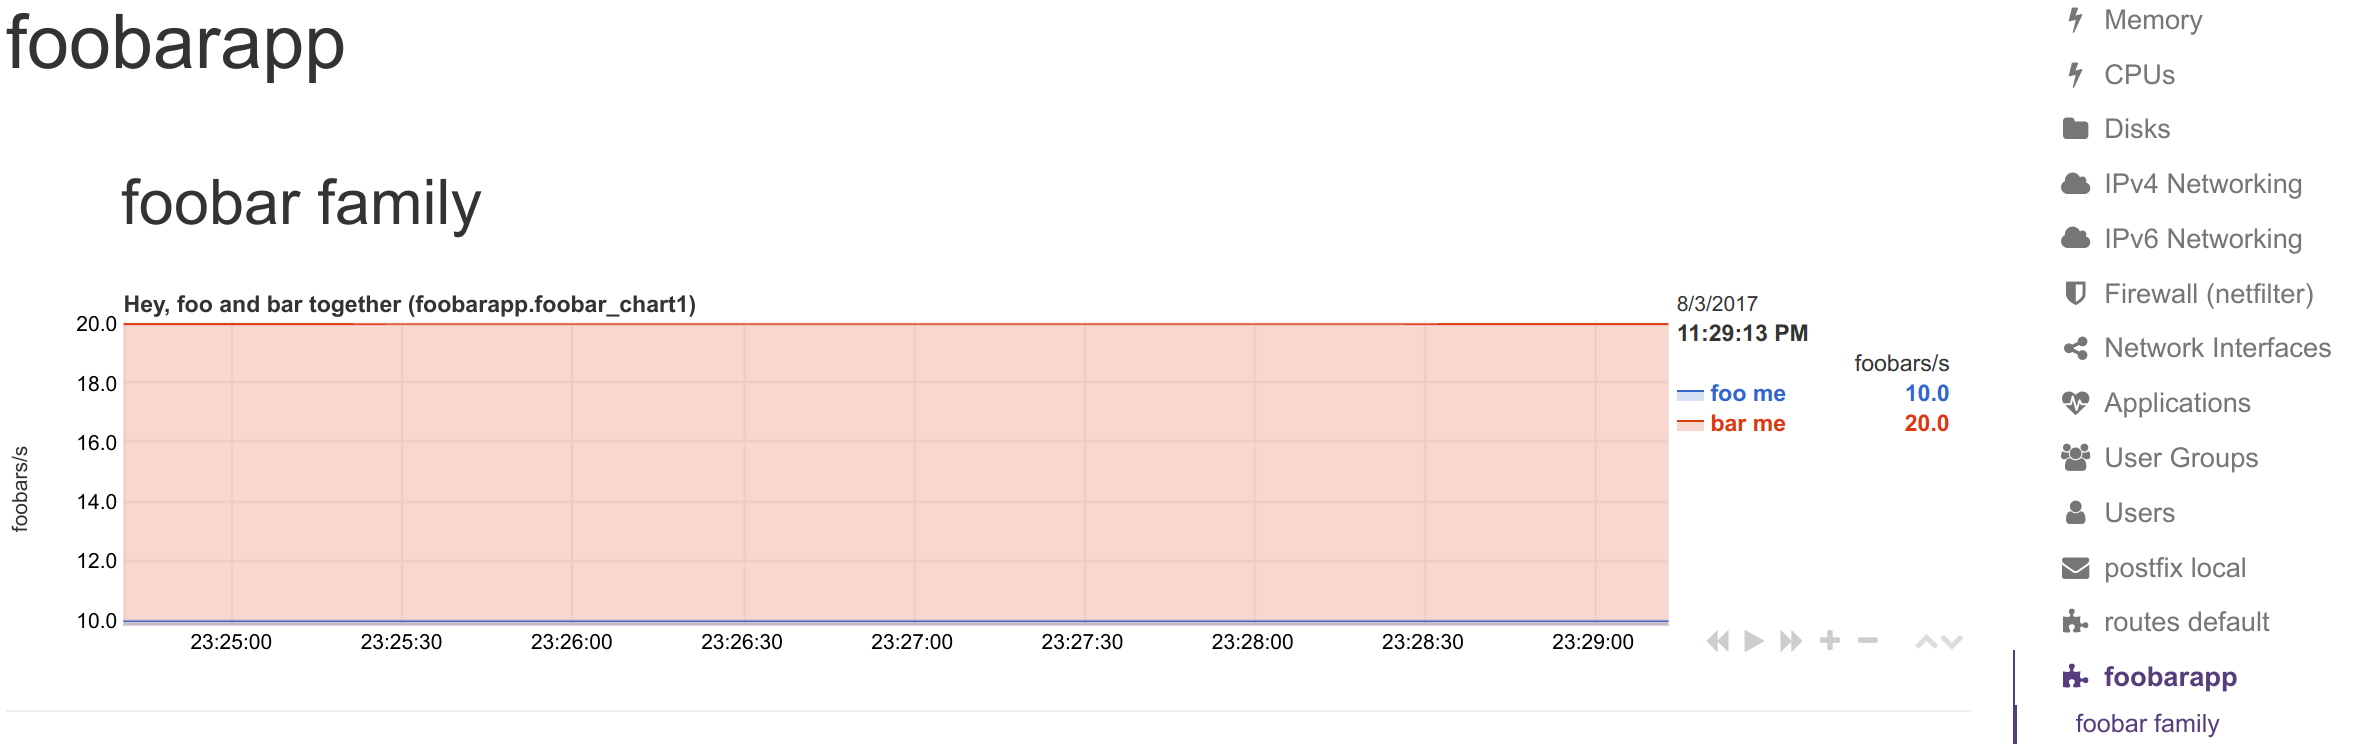
Metrics sent to statsd: foo:10|g and bar:20|g.
Private charts:
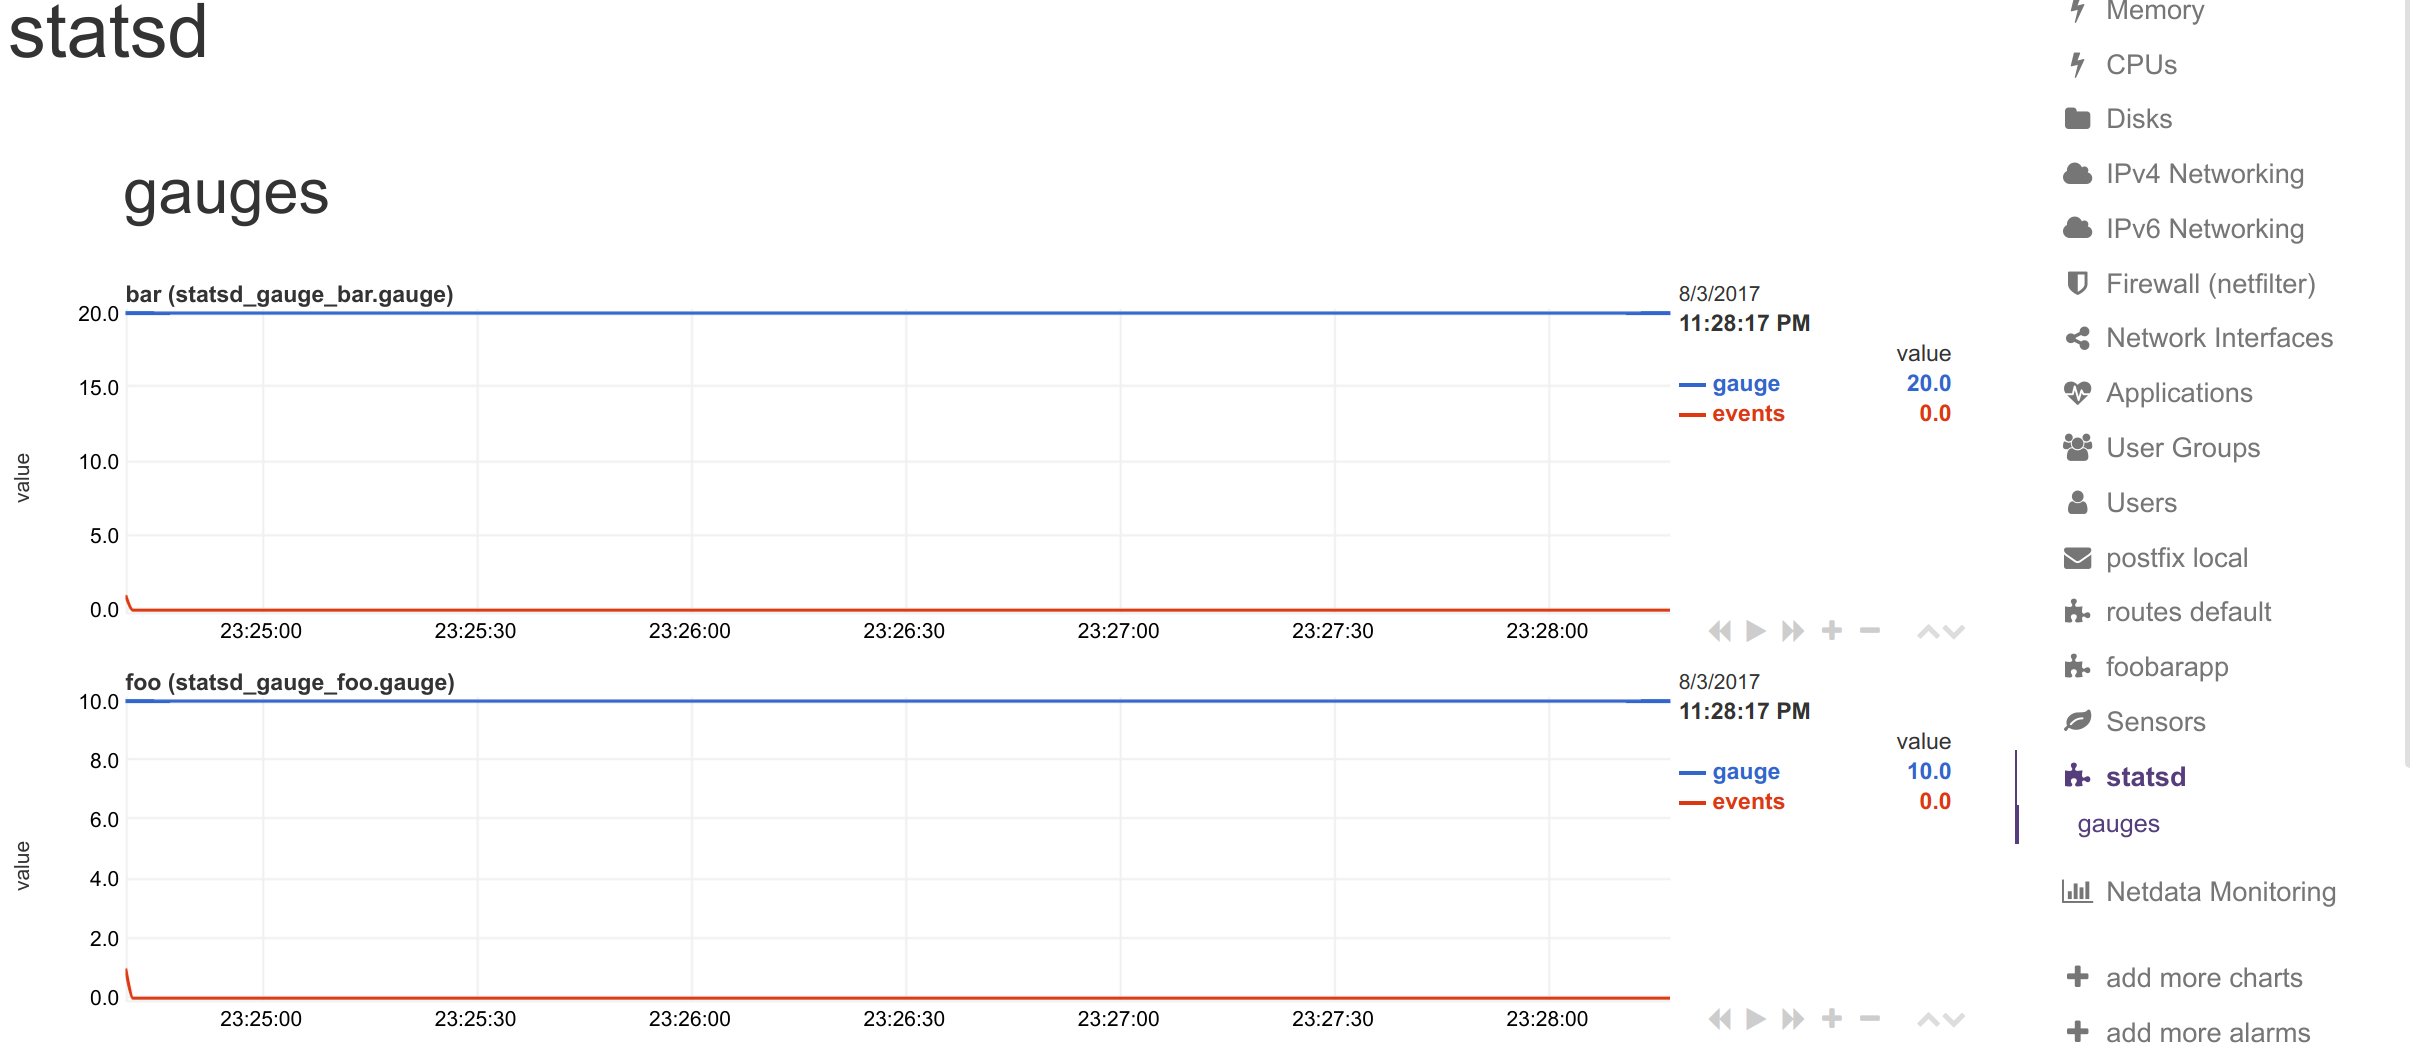
Synthetic chart:
Renaming StatsD synthetic charts' metrics
You can define a dictionary to rename metrics sent by StatsD clients. This enables you to send response "200" and Netdata visualize it as succesful connection
The [dictionary] section accepts any number of name = value pairs.
Netdata uses this dictionary as follows:
-
When a
dimensionhas a non-emptyNAME, that name is looked up at the dictionary. -
If the above lookup gives nothing, or the
dimensionhas an emptyNAME, the original StatsD metric name is looked up at the dictionary. -
If any of the above succeeds, Netdata uses the
valueof the dictionary, to set the name of the dimension. The dimensions will have as ID the original StatsD metric name, and as name, the dictionary value.
Use the dictionary in 2 ways:
- set
dimension = myapp.metric1 ''and have at the dictionarymyapp.metric1 = metric1 name - set
dimension = myapp.metric1 'm1'and have at the dictionarym1 = metric1 name
In both cases, the dimension will be added with ID myapp.metric1 and will be named metric1 name. So, in alarms use either of the 2 as ${myapp.metric1} or ${metric1 name}.
keep in mind that if you add multiple times the same StatsD metric to a chart, Netdata will append
TYPEto the dimension ID, somyapp.metric1will be added asmyapp.metric1_lastormyapp.metric1_events, etc. If you add multiple times the same metric with the sameTYPEto a chart, Netdata will also append an incremental counter to the dimension ID, i.e.myapp.metric1_last1,myapp.metric1_last2, etc.
Dimension patterns
Netdata allows adding multiple dimensions to a chart, by matching the StatsD metrics with a Netdata simple pattern.
Assume we have an API that provides StatsD metrics for each response code per method it supports, like these:
myapp.api.get.200
myapp.api.get.400
myapp.api.get.500
myapp.api.del.200
myapp.api.del.400
myapp.api.del.500
myapp.api.post.200
myapp.api.post.400
myapp.api.post.500
myapp.api.all.200
myapp.api.all.400
myapp.api.all.500
In order to add all the response codes of myapp.api.get to a chart, we simply make the following configuration:
[api_get_responses]
   ...
   dimension = pattern 'myapp.api.get.* '' last 1 1
The above will add dimension named 200, 400 and 500. Netdata extracts the wildcard part of the metric name - so the dimensions will be named with whatever the * matched.
You can rename the dimensions with this:
[dictionary]
    get.200 = 200 ok
    get.400 = 400 bad request
    get.500 = 500 cannot connect to db

[api_get_responses]
   ...
   dimension = pattern 'myapp.api.get.* 'get.' last 1 1
Note that we added a NAME to the dimension line with get.. This is prefixed to the wildcarded part of the metric name, to compose the key for looking up the dictionary. So 500 became get.500 which was looked up to the dictionary to find value 500 cannot connect to db. This way we can have different dimension names, for each of the API methods (i.e. get.500 = 500 cannot connect to db while post.500 = 500 cannot write to disk).
To add all 200s across all API methods to a chart, you can do this:
[ok_by_method]
   ...
   dimension = pattern 'myapp.api.*.200 '' last 1 1
The above will add get, post, del and all to the chart.
If all is not wanted (a stacked chart does not need the all dimension, since the sum of the dimensions provides the total), the line should be:
[ok_by_method]
   ...
   dimension = pattern '!myapp.api.all.* myapp.api.*.200 '' last 1 1
With the above, all methods except all will be added to the chart.
To automatically rename the methods, you can use this:
[dictionary]
    method.get = GET
    method.post = ADD
    method.del = DELETE

[ok_by_method]
   ...
   dimension = pattern '!myapp.api.all.* myapp.api.*.200 'method.' last 1 1
Using the above, the dimensions will be added as GET, ADD and DELETE.
StatsD examples
Python
It's really easy to instrument your python application with StatsD, for example using jsocol/pystatsd.
import statsd
c = statsd.StatsClient('localhost', 8125)
c.incr('foo') # Increment the 'foo' counter.
for i in range(100000000):
   c.incr('bar')
   c.incr('foo')
   if i % 3:
       c.decr('bar')
       c.timing('stats.timed', 320) # Record a 320ms 'stats.timed'.
You can find detailed documentation in their documentation page.
Javascript and Node.js
Using the client library by sivy/node-statsd, you can easily embed StatsD into your Node.js project.
  var StatsD = require('node-statsd'),
      client = new StatsD();

  // Timing: sends a timing command with the specified milliseconds
  client.timing('response_time', 42);

  // Increment: Increments a stat by a value (default is 1)
  client.increment('my_counter');

  // Decrement: Decrements a stat by a value (default is -1)
  client.decrement('my_counter');

  // Using the callback
  client.set(['foo', 'bar'], 42, function(error, bytes){
    //this only gets called once after all messages have been sent
    if(error){
      console.error('Oh noes! There was an error:', error);
    } else {
      console.log('Successfully sent', bytes, 'bytes');
    }
  });

  // Sampling, tags and callback are optional and could be used in any combination
  client.histogram('my_histogram', 42, 0.25); // 25% Sample Rate
  client.histogram('my_histogram', 42, ['tag']); // User-defined tag
  client.histogram('my_histogram', 42, next); // Callback
  client.histogram('my_histogram', 42, 0.25, ['tag']);
  client.histogram('my_histogram', 42, 0.25, next);
  client.histogram('my_histogram', 42, ['tag'], next);
  client.histogram('my_histogram', 42, 0.25, ['tag'], next);
Other languages
You can also use StatsD with:
- Golang, thanks to alexcesaro/statsd
- Ruby, thanks to reinh/statsd
- Java, thanks to DataDog/java-dogstatsd-client
Shell
Getting the proper support for a programming language is not always easy, but the Unix shell is available on most Unix systems. You can use shell and nc to instrument your systems and send metric data to Netdata's StatsD implementation.
Using the method you can send metrics from any script. You can generate events like: backup.started, backup.ended, backup.time, or even tail logs and convert them to metrics.
IMPORTANT:
To send StatsD messages you need from the
netcatpackage, thenccommand. There are multiple versions of this package. Please try to experiment with thenccommand you have available on your right system, to find the right parameters.In the examples below, we assume the
openbsd-netcatis installed.
If you plan to send short StatsD events at sporadic occasions, use UDP. The messages should not be too long (remember, most networks support up to 1500 bytes MTU, which is also the limit for StatsD messages over UDP). The good thing is that using UDP will not block your script, even if the StatsD server is not there (UDP messages are "fire-and-forget").
For UDP use this:
echo "APPLICATION.METRIC:VALUE|TYPE" | nc -u -w 0 localhost 8125
-u turns on UDP, -w 0 tells nc not to wait for a response from StatsD (idle time to close the connection).
where:
APPLICATIONis any name for your applicationMETRICis the name for the specific metricVALUEis the value for that metric (meters, counters, gauges, timers and histograms accept integer/decimal/fractional numbers, sets and dictionaries accept strings)TYPEis one ofm,c,g,ms,h,s,dto define the metric type.
For tailing a log and converting it to metrics, do something like this:
tail -f some.log | awk 'awk commands to parse the log and format statsd metrics' | nc -N -w 120 localhost 8125
-N tells nc to close the socket once it receives EOF on its input. -w 120 tells nc to stop if the connection is idle for 120 seconds. The timeout is needed to stop the nc command if you restart Netdata while nc is connected to it. Without it, nc will sit idle forever.
When you embed the above commands to a script, you may notice that all the metrics are sent to StatsD with a delay. They are buffered in the pipes |. You can turn them to real-time by prepending each command with stdbuf -i0 -oL -eL command to be run, like this:
stdbuf -i0 -oL -eL tail -f some.log |\
 stdbuf -i0 -oL -eL awk 'awk commands to parse the log and format statsd metrics' |\
  stdbuf -i0 -oL -eL nc -N -w 120 localhost 8125
If you use mawk you also need to run awk with -W interactive.
Examples:
To set myapp.used_memory as gauge to value 123456, use:
echo "myapp.used_memory:123456|g|#units:bytes" | nc -u -w 0 localhost 8125
To increment myapp.files_sent by 10, as a counter, use:
echo "myapp.files_sent:10|c|#units:files" | nc -u -w 0 localhost 8125
You can send multiple metrics like this:
# send multiple metrics via UDP
printf "myapp.used_memory:123456|g|#units:bytes\nmyapp.files_sent:10|c|#units:files\n" | nc -u  -w 0 localhost 8125
Remember, for UDP communication each packet should not exceed the MTU. So, if you plan to push too many metrics at once, prefer TCP communication:
# send multiple metrics via TCP
cat /tmp/statsd.metrics.txt | nc -N -w 120 localhost 8125
You can also use this little function to take care of all the details:
#!/usr/bin/env bash

# we assume nc is from the openbsd-netcat package

STATSD_HOST="localhost"
STATSD_PORT="8125"
statsd() {
        local options="-u -w 0" all="${*}"

        # replace all spaces with newlines
        all="${all// /\\n}"

        # if the string length of all parameters given is above 1000, use TCP
        [ "${#all}" -gt 1000 ] && options="-N -w 0"

        # send the metrics to statsd
        printf "${all}\n" | nc ${options} ${STATSD_HOST} ${STATSD_PORT} || return 1

        return 0
}

if [ ! -z "${*}" ]
then
  statsd "${@}"
fi
You can use it like this:
# first, source it in your script
source statsd.sh

# then, at any point:
statsd "myapp.used_memory:123456|g|#units:bytes" "myapp.files_sent:10|c|#units:files" ...
or even at a terminal prompt, like this:
./statsd.sh "myapp.used_memory:123456|g|#units:bytes" "myapp.files_sent:10|c|#units:files" ...
The function is smart enough to call nc just once and pass all the metrics to it. It will also automatically switch to TCP if the metrics to send are above 1000 bytes.
If you have gotten thus far, make sure to check out our community forums to share your experience using Netdata with StatsD.