4.3 KiB
Netdata for IoT

New to Netdata? Check its demo: https://my-netdata.io/


Netdata is a very efficient server performance monitoring solution. When running in server hardware, it can collect thousands of system and application metrics per second with just 1% CPU utilization of a single core. Its web server responds to most data requests in about half a millisecond making its web dashboards spontaneous, amazingly fast!
Netdata can also be a very efficient real-time monitoring solution for IoT devices (RPIs, routers, media players, wifi access points, industrial controllers and sensors of all kinds). Netdata will generally run everywhere a Linux kernel runs (and it is glibc and musl-libc friendly).
You can use it as both a data collection agent (where you pull data using its API), for embedding its charts on other web pages / consoles, but also for accessing it directly with your browser to view its dashboard.
The Netdata web API already provides reduce functions allowing it to report average and max for any timeframe. It can also respond in many formats including JSON, JSONP, CSV, HTML. Its API is also a google charts provider so it can directly be used by google sheets, google charts, google widgets.

Although Netdata has been significantly optimized to lower the CPU and RAM resources it consumes, the plethora of data collection plugins may be inappropriate for weak IoT devices. Please follow the Netdata Agent performance guide
Monitoring RPi temperature
The python version of the sensors plugin uses lm-sensors. Unfortunately the temperature reading of RPi are not
supported by lm-sensors.
Netdata also has a bash version of the sensors plugin that can read RPi temperatures. It is disabled by default to avoid the conflicts with the python version.
To enable it, run:
cd /etc/netdata # Replace this path with your Netdata config directory
sudo ./edit-config charts.d.conf
and uncomment this line:
sensors=force
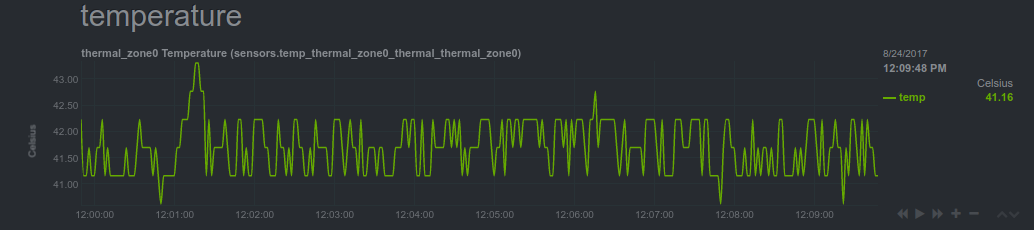
Then restart Netdata. You will get this: