mirror of
https://github.com/netdata/netdata.git
synced 2025-04-27 06:10:43 +00:00
* Add options to daemon, clean up claiming

* Caught one more old conf

* Remove cloud docs

* I did a lot of things

* Rewrite tutorial step 3

* Remove my nodes menu, sync what-is-netdata

* Restore ACLK/claim/daemon docs to be handled by docs-go-live

* Fix up what-is-netdata

* More cleanup of README/what-is-netdata

* Restore daemon/config/README.md

* Fix frontmatter

* Change title, fix broken link

* Copyediting fixes

* Remove symbols

* Add a few more GIFs

* Fix hash

* Fix other hash

* Fix wording in web gui

* Address Andrew's and Jacek's comments
251 lines
12 KiB
Markdown
251 lines
12 KiB
Markdown
<!--
|
|
---
|
|
title: "Get started guide"
|
|
date: 2020-05-04
|
|
custom_edit_url: https://github.com/netdata/netdata/edit/master/docs/getting-started.md
|
|
---
|
|
-->
|
|
|
|
# Get started guide
|
|
|
|
Thanks for trying the Netdata Agent! In this getting started guide, we'll quickly walk you through the first steps you
|
|
should take after installing the Agent.
|
|
|
|
The Agent can collect thousands of metrics in real-time and use its database for long-term metrics storage without any
|
|
configuration, but there are some valuable things to know to get the most out of Netdata based on your needs.
|
|
|
|
We'll skip right into some technical details, so if you're brand-new to monitoring the health and performance of systems
|
|
and applications, our [**step-by-step tutorial**](/docs/step-by-step/step-00.md) might be a better fit.
|
|
|
|
> If you haven't installed Netdata yet, visit the [installation instructions](/packaging/installer/README.md) for
|
|
> details, including our one-liner script, which automatically installs Netdata on almost all Linux distributions.
|
|
|
|
## Access the dashboard
|
|
|
|
Open up your web browser of choice and navigate to `http://NODE:19999`, replacing `NODE` with the IP address or hostname
|
|
of your Agent. Hit **Enter**. Welcome to Netdata!
|
|
|
|

|
|
|
|
**What's next?**:
|
|
|
|
- Read more about the [standard Netdata dashboard](/web/gui/).
|
|
- Learn all the specifics of [using charts](/web/README.md#using-charts) or the differences between [charts,
|
|
context, and families](/web/README.md#charts-contexts-families).
|
|
|
|
## Configuration basics
|
|
|
|
Netdata primarily uses the `netdata.conf` file for custom configurations.
|
|
|
|
On most systems, you can find that file at `/etc/netdata/netdata.conf`.
|
|
|
|
> Some operating systems will place your `netdata.conf` at `/opt/netdata/etc/netdata/netdata.conf`, so check there if
|
|
> you find nothing at `/etc/netdata/netdata.conf`.
|
|
|
|
The `netdata.conf` file is broken up into various sections, such as `[global]`, `[web]`, `[registry]`, and more. By
|
|
default, most options are commented, so you'll have to uncomment them (remove the `#`) for Netdata to recognize your
|
|
change.
|
|
|
|
Once you save your changes, [restart Netdata](#start-stop-and-restart-netdata) to load your new configuration.
|
|
|
|
**What's next?**:
|
|
|
|
- [Change how long Netdata stores metrics](#change-how-long-netdata-stores-metrics) by changing the `page cache size`
|
|
and `dbengine disk space` settings in `netdata.conf`.
|
|
- Move Netdata's dashboard to a [different port](/web/server/) or enable TLS/HTTPS
|
|
encryption.
|
|
- See all the `netdata.conf` options in our [daemon configuration documentation](/daemon/config/).
|
|
- Run your own [registry](/registry/README.md#run-your-own-registry).
|
|
|
|
## Change how long Netdata stores metrics
|
|
|
|
Netdata can store long-term, historical metrics out of the box. A custom database uses RAM to store recent metrics,
|
|
ensuring dashboards and API queries are extremely responsive, while "spilling" historical metrics to disk. This
|
|
configuration keeps RAM usage low while allowing for long-term, on-disk metrics storage.
|
|
|
|
You can tweak this custom _database engine_ to store a much larger dataset than your system's available RAM,
|
|
particularly if you allow Netdata to use slightly more RAM and disk space than the default configuration.
|
|
|
|
Read our tutorial, [**Changing how long Netdata stores metrics**](/docs/tutorials/longer-metrics-storage.md), to learn
|
|
more.
|
|
|
|
**What's next?**:
|
|
|
|
- Learn more about the [memory requirements for the database
|
|
engine](/database/engine/README.md#memory-requirements) to understand how much RAM/disk space you should commit
|
|
to storing historical metrics.
|
|
|
|
## Collect data from more sources
|
|
|
|
When Netdata _starts_, it auto-detects dozens of **data sources**, such as database servers, web servers, and more. To
|
|
auto-detect and collect metrics from a service or application you just installed, you need to [restart
|
|
Netdata](#start-stop-and-restart-netdata).
|
|
|
|
> There is one exception: When Netdata is running on the host (as in not in a container itself), it will always
|
|
> auto-detect containers and VMs.
|
|
|
|
However, auto-detection only works if you installed the source using its standard installation procedure. If Netdata
|
|
isn't collecting metrics after a restart, your source probably isn't configured correctly. Look at the [external plugin
|
|
documentation](/collectors/plugins.d/) to find the appropriate module for your source. Those pages will contain
|
|
more information about how to configure your source for auto-detection.
|
|
|
|
Some modules, like `chrony`, are disabled by default and must be enabled manually for auto-detection to work.
|
|
|
|
Once Netdata detects a valid source of data, it will continue trying to collect data from it. For example, if
|
|
Netdata is collecting data from an Nginx web server, and you shut Nginx down, Netdata will collect new data as soon as
|
|
you start the web server back up—no restart necessary.
|
|
|
|
### Configure plugins
|
|
|
|
Even if Netdata auto-detects your service/application, you might want to configure what, or how often, Netdata is
|
|
collecting data.
|
|
|
|
Netdata uses **internal** and **external** plugins to collect data. Internal plugins run within the Netdata dæmon, while
|
|
external plugins are independent processes that send metrics to Netdata over pipes. There are also plugin
|
|
**orchestrators**, which are external plugins with one or more data collection **modules**.
|
|
|
|
You can configure both internal and external plugins, along with the individual modules. There are many ways to do so:
|
|
|
|
- In `netdata.conf`, `[plugins]` section: Enable or disable internal or external plugins with `yes` or `no`.
|
|
- In `netdata.conf`, `[plugin:XXX]` sections: Each plugin has a section for changing collection frequency or passing
|
|
options to the plugin.
|
|
- In `.conf` files for each external plugin: For example, at `/etc/netdata/python.d.conf`.
|
|
- In `.conf` files for each module : For example, at `/etc/netdata/python.d/nginx.conf`.
|
|
|
|
It's complex, so let's walk through an example of the various `.conf` files responsible for collecting data from an
|
|
Nginx web server using the `nginx` module and the `python.d` plugin orchestrator.
|
|
|
|
First, you can enable or disable the `python.d` plugin entirely in `netdata.conf`.
|
|
|
|
```conf
|
|
[plugins]
|
|
# Enabled
|
|
python.d = yes
|
|
# Disabled
|
|
python.d = no
|
|
```
|
|
|
|
You can also configure the entire `python.d` external plugin via the `[plugin:python.d]` section in `netdata.conf`.
|
|
Here, you can change how often Netdata uses `python.d` to collect metrics or pass other command options:
|
|
|
|
```conf
|
|
[plugin:python.d]
|
|
update every = 1
|
|
command options =
|
|
```
|
|
|
|
The `python.d` plugin has a separate configuration file at `/etc/netdata/python.d.conf` for enabling and disabling
|
|
modules. You can use the `edit-config` script to edit the file, or open it with your text editor of choice:
|
|
|
|
```bash
|
|
sudo /etc/netdata/edit-config python.d.conf
|
|
```
|
|
|
|
Finally, the `nginx` module has a configuration file called `nginx.conf` in the `python.d` folder. Again, use
|
|
`edit-config` or your editor of choice:
|
|
|
|
```bash
|
|
sudo /etc/netdata/edit-config python.d/nginx.conf
|
|
```
|
|
|
|
In the `nginx.conf` file, you'll find additional options. The default works in most situations, but you may need to make
|
|
changes based on your particular Nginx setup.
|
|
|
|
**What's next?**:
|
|
|
|
- Look at the [full list of data collection modules](/collectors/COLLECTORS.md)
|
|
to configure your sources for auto-detection and monitoring.
|
|
- Improve the [performance](/docs/Performance.md) of Netdata on low-memory systems.
|
|
- Configure `systemd` to expose [systemd services
|
|
utilization](/collectors/cgroups.plugin/README.md#monitoring-systemd-services) metrics automatically.
|
|
- [Reconfigure individual charts](/daemon/config/README.md#per-chart-configuration) in `netdata.conf`.
|
|
|
|
## Health monitoring and alarms
|
|
|
|
Netdata comes with hundreds of health monitoring alarms for detecting anomalies on production servers. If you're running
|
|
Netdata on a workstation, you might want to disable Netdata's alarms.
|
|
|
|
Edit your `/etc/netdata/netdata.conf` file and set the following:
|
|
|
|
```conf
|
|
[health]
|
|
enabled = no
|
|
```
|
|
|
|
If you want to keep health monitoring enabled, but turn email notifications off, edit your `health_alarm_notify.conf`
|
|
file with `edit-config`, or with the text editor of your choice:
|
|
|
|
```bash
|
|
sudo /etc/netdata/edit-config health_alarm_notify.conf
|
|
```
|
|
|
|
Find the `SEND_EMAIL="YES"` line and change it to `SEND_EMAIL="NO"`.
|
|
|
|
**What's next?**:
|
|
|
|
- Follow the [health quickstart](/health/QUICKSTART.md) to locate and edit existing health entities, and then
|
|
create your own.
|
|
- See all the alarm options via the [health configuration reference](/health/REFERENCE.md).
|
|
- Add a new notification method, like [Slack](/health/notifications/slack/).
|
|
|
|
## Monitor multiple systems with Netdata Cloud
|
|
|
|
If you have the Agent installed on multiple nodes, you can use Netdata Cloud in two ways: Monitor the health and
|
|
performance of an entire infrastructure via the Cloud web interface, or use the Visited Nodes menu that's built into
|
|
every dashboard.
|
|
|
|
For example, a small infrastructure monitored via Netdata Cloud:
|
|
|
|

|
|
|
|
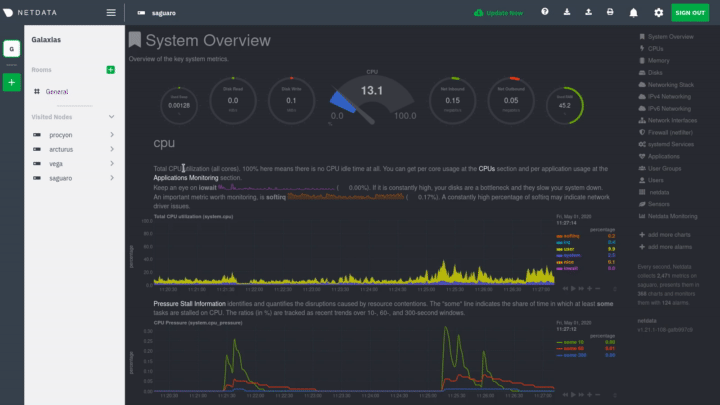
And the process of using the Visited nodes menu to move between Agent dashboards running on various systems, both local
|
|
and remote:
|
|
|
|
|
|
|
|
You can use these features together or separately—the decision is up to you and the needs of your infrastructure.
|
|
|
|
**What's next?**:
|
|
|
|
- Read about the [Agent-Cloud integration]().
|
|
- Get an overview of Cloud's features by reading [Cloud documentation](https://learn.netdata.cloud/docs/cloud/).
|
|
- Follow the 5-minute [get started with Cloud](https://learn.netdata.cloud/docs/cloud/get-started/) guide to finish
|
|
onboarding and claim your first nodes.
|
|
- Better understand how agents connect securely to the Cloud with [claiming](/claim/README.md) and [Agent-Cloud
|
|
link](/aclk/README.md) documentation.
|
|
|
|
## Start, stop, and restart Netdata
|
|
|
|
When you install Netdata, it's configured to start at boot, and stop and restart/shutdown. You shouldn't need to start
|
|
or stop Netdata manually, but you will probably need to restart Netdata at some point.
|
|
|
|
- To **start** Netdata, open a terminal and run `service netdata start`.
|
|
- To **stop** Netdata, run `service netdata stop`.
|
|
- To **restart** Netdata, run `service netdata restart`.
|
|
|
|
The `service` command is a wrapper script that tries to use your system's preferred method of starting or stopping
|
|
Netdata based on your system. But, if either of those commands fails, try using the equivalent commands for `systemd`
|
|
and `init.d`:
|
|
|
|
- **systemd**: `systemctl start netdata`, `systemctl stop netdata`, `systemctl restart netdata`
|
|
- **init.d**: `/etc/init.d/netdata start`, `/etc/init.d/netdata stop`, `/etc/init.d/netdata restart`
|
|
|
|
## What's next?
|
|
|
|
Even after you've configured `netdata.conf`, tweaked alarms, learned the basics of performance troubleshooting, and
|
|
claimed all your systems in Netdata Cloud or added them to the Visited nodes menu, you've just gotten started with
|
|
Netdata.
|
|
|
|
Take a look at some more advanced features and configurations:
|
|
|
|
- Centralize Netdata metrics from many systems with [streaming](/streaming/README.md)
|
|
- Enable long-term archiving of Netdata metrics via [backends](/backends/README.md) to time-series databases.
|
|
- Improve security by putting Netdata behind an [Nginx proxy with SSL](/docs/Running-behind-nginx.md).
|
|
|
|
Or, learn more about how you can contribute to [Netdata core](/CONTRIBUTING.md) or our
|
|
[documentation](/docs/contributing/contributing-documentation.md)!
|
|
|
|
[](<>)
|