mirror of
https://github.com/netdata/netdata.git
synced 2025-04-27 06:10:43 +00:00
39 lines
2.8 KiB
Markdown
39 lines
2.8 KiB
Markdown
# Nodes tab
|
|
|
|
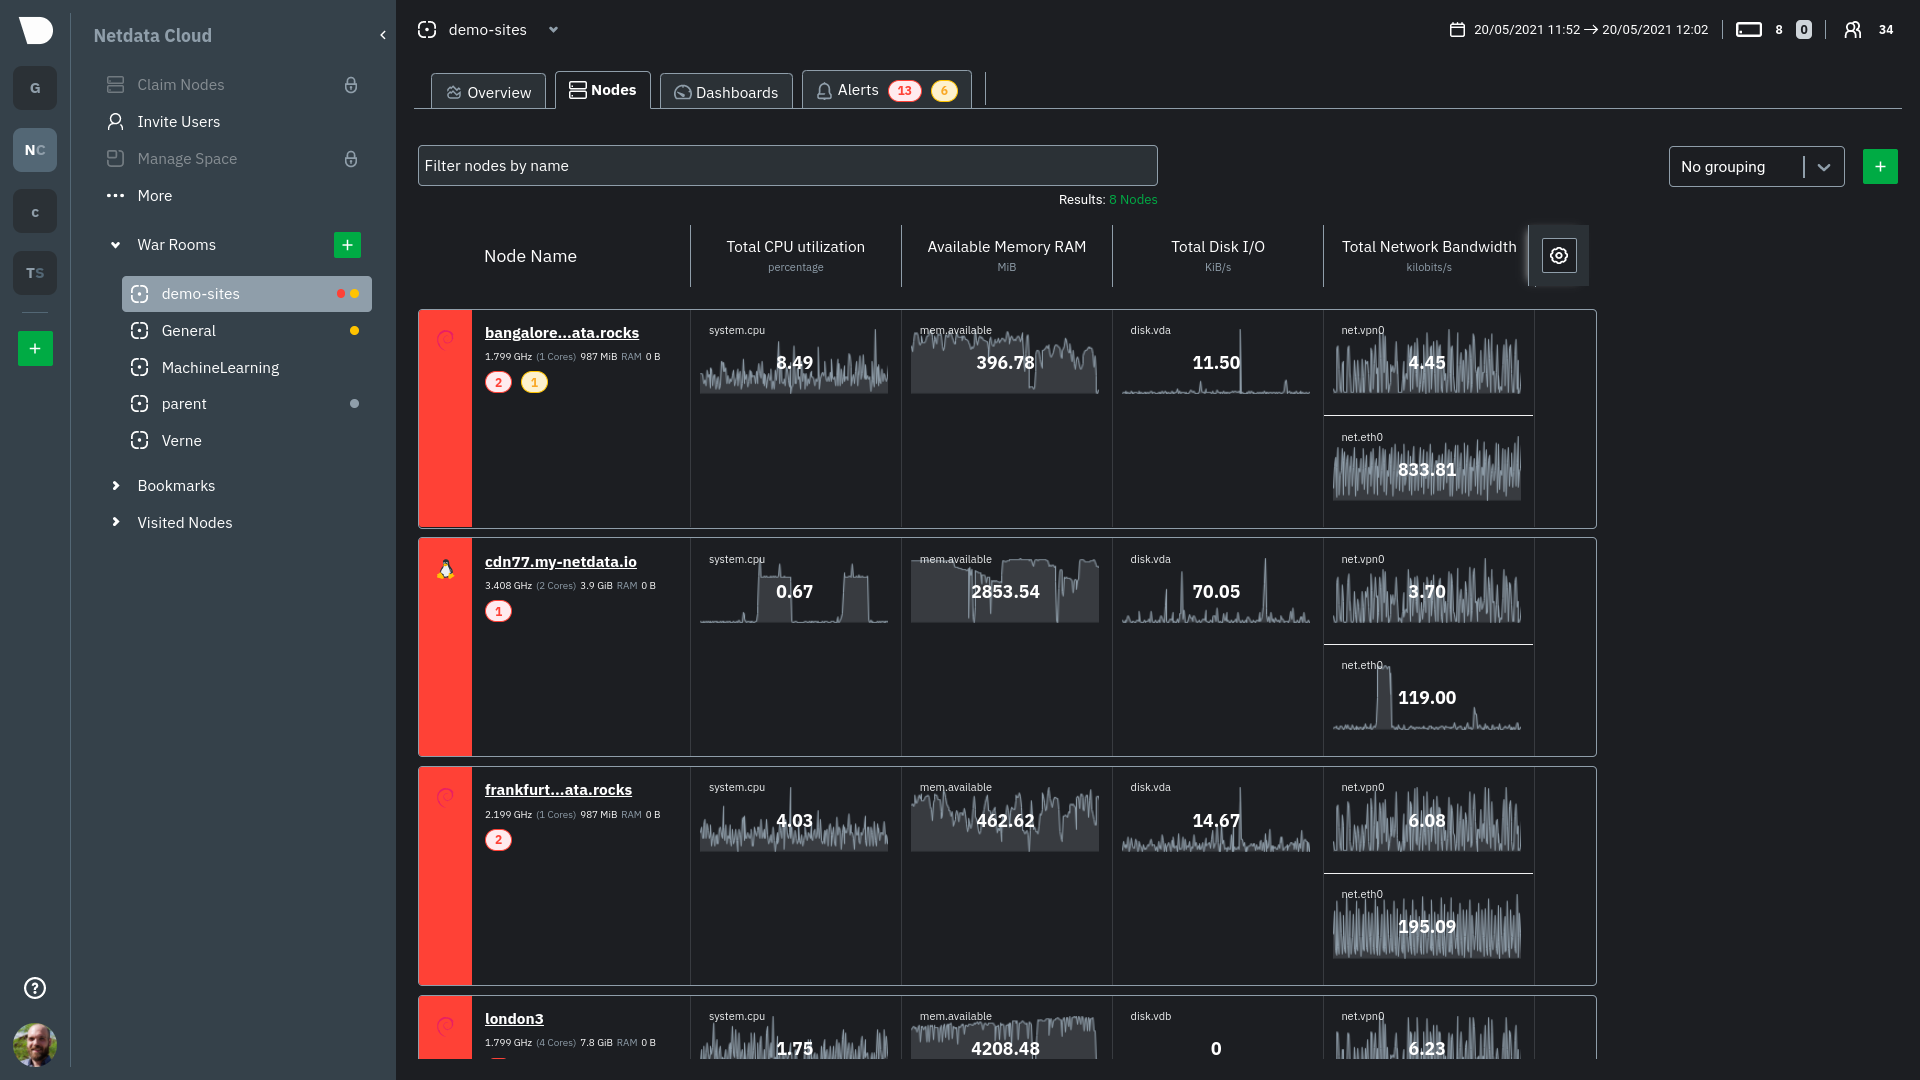
The Nodes tab lets you see and customize key metrics from any number of Agent-monitored nodes and seamlessly navigate
|
|
to any node's dashboard for troubleshooting performance issues or anomalies using Netdata's highly-granular metrics.
|
|
|
|
|
|
|
|
Each War Room's Nodes tab is populated based on the nodes you added to that specific War Room. Each node occupies a
|
|
single row, first featuring that node's alert status (yellow for warnings, red for critical alerts) and operating
|
|
system, some essential information about the node, followed by columns of user-defined key metrics represented in
|
|
real-time charts.
|
|
|
|
Use the [Overview](https://github.com/netdata/netdata/blob/master/docs/cloud/visualize/overview.md) for monitoring an infrastructure in real time using
|
|
composite charts and Netdata's familiar dashboard UI.
|
|
|
|
Check the [node
|
|
filter](https://github.com/netdata/netdata/blob/master/docs/cloud/visualize/node-filter.md) and the [Visualization date time controls
|
|
selector](https://github.com/netdata/netdata/blob/master/docs/dashboard/visualization-date-and-time-controls.md) for tools available on the utility bar.
|
|
|
|
## Add and customize metrics columns
|
|
|
|
Add more metrics columns by clicking the gear icon. Choose the context you'd like to add, give it a relevant name, and
|
|
select whether you want to see all dimensions (the default), or only the specific dimensions your team is interested in.
|
|
|
|
Click the gear icon and hover over any existing charts, then click the pencil icon. This opens a panel to
|
|
edit that chart. Edit the context, its title, add or remove dimensions, or delete the chart altogether.
|
|
|
|
These customizations appear for anyone else with access to that War Room.
|
|
|
|
## See more metrics in Netdata Cloud
|
|
|
|
If you want to add more metrics to your War Rooms and they don't show up when you add new metrics to Nodes, you likely
|
|
need to configure those nodes to collect from additional data sources. See our [collectors configuration reference](https://github.com/netdata/netdata/blob/master/src/collectors/REFERENCE.md)
|
|
to learn how to use dozens of pre-installed collectors that can instantly collect from your favorite services and applications.
|
|
|
|
If you want to see up to 30 days of historical metrics in Cloud (and more on individual node dashboards), read about [changing how long Netdata stores metrics](https://github.com/netdata/netdata/blob/master/docs/store/change-metrics-storage.md). Also, see our
|
|
[calculator](https://github.com/netdata/netdata/blob/master/docs/store/change-metrics-storage.md#calculate-the-system-resources-ram-disk-space-needed-to-store-metrics)
|
|
for finding the disk and RAM you need to store metrics for a certain period of time.
|