mirror of
https://github.com/netdata/netdata.git
synced 2025-04-16 02:24:15 +00:00
* spelling: activity

Signed-off-by: Josh Soref <jsoref@users.noreply.github.com>

* spelling: adding

Signed-off-by: Josh Soref <jsoref@users.noreply.github.com>

* spelling: addresses

Signed-off-by: Josh Soref <jsoref@users.noreply.github.com>

* spelling: administrators

Signed-off-by: Josh Soref <jsoref@users.noreply.github.com>

* spelling: alarm

Signed-off-by: Josh Soref <jsoref@users.noreply.github.com>

* spelling: alignment

Signed-off-by: Josh Soref <jsoref@users.noreply.github.com>

* spelling: analyzing

Signed-off-by: Josh Soref <jsoref@users.noreply.github.com>

* spelling: apcupsd

Signed-off-by: Josh Soref <jsoref@users.noreply.github.com>

* spelling: apply

Signed-off-by: Josh Soref <jsoref@users.noreply.github.com>

* spelling: around

Signed-off-by: Josh Soref <jsoref@users.noreply.github.com>

* spelling: associated

Signed-off-by: Josh Soref <jsoref@users.noreply.github.com>

* spelling: automatically

Signed-off-by: Josh Soref <jsoref@users.noreply.github.com>

* spelling: availability

Signed-off-by: Josh Soref <jsoref@users.noreply.github.com>

* spelling: background

Signed-off-by: Josh Soref <jsoref@users.noreply.github.com>

* spelling: bandwidth

Signed-off-by: Josh Soref <jsoref@users.noreply.github.com>

* spelling: berkeley

Signed-off-by: Josh Soref <jsoref@users.noreply.github.com>

* spelling: between

Signed-off-by: Josh Soref <jsoref@users.noreply.github.com>

* spelling: celsius

Signed-off-by: Josh Soref <jsoref@users.noreply.github.com>

* spelling: centos

Signed-off-by: Josh Soref <jsoref@users.noreply.github.com>

* spelling: certificate

Signed-off-by: Josh Soref <jsoref@users.noreply.github.com>

* spelling: cockroach

Signed-off-by: Josh Soref <jsoref@users.noreply.github.com>

* spelling: collectors

Signed-off-by: Josh Soref <jsoref@users.noreply.github.com>

* spelling: concatenation

Signed-off-by: Josh Soref <jsoref@users.noreply.github.com>

* spelling: configuration

Signed-off-by: Josh Soref <jsoref@users.noreply.github.com>

* spelling: configured

Signed-off-by: Josh Soref <jsoref@users.noreply.github.com>

* spelling: continuous

Signed-off-by: Josh Soref <jsoref@users.noreply.github.com>

* spelling: correctly

Signed-off-by: Josh Soref <jsoref@users.noreply.github.com>

* spelling: corresponding

Signed-off-by: Josh Soref <jsoref@users.noreply.github.com>

* spelling: cyberpower

Signed-off-by: Josh Soref <jsoref@users.noreply.github.com>

* spelling: daemon

Signed-off-by: Josh Soref <jsoref@users.noreply.github.com>

* spelling: dashboard

Signed-off-by: Josh Soref <jsoref@users.noreply.github.com>

* spelling: database

Signed-off-by: Josh Soref <jsoref@users.noreply.github.com>

* spelling: deactivating

Signed-off-by: Josh Soref <jsoref@users.noreply.github.com>

* spelling: dependencies

Signed-off-by: Josh Soref <jsoref@users.noreply.github.com>

* spelling: deployment

Signed-off-by: Josh Soref <jsoref@users.noreply.github.com>

* spelling: determine

Signed-off-by: Josh Soref <jsoref@users.noreply.github.com>

* spelling: downloading

Signed-off-by: Josh Soref <jsoref@users.noreply.github.com>

* spelling: either

Signed-off-by: Josh Soref <jsoref@users.noreply.github.com>

* spelling: electric

Signed-off-by: Josh Soref <jsoref@users.noreply.github.com>

* spelling: entity

Signed-off-by: Josh Soref <jsoref@users.noreply.github.com>

* spelling: entrant

Signed-off-by: Josh Soref <jsoref@users.noreply.github.com>

* spelling: enumerating

Signed-off-by: Josh Soref <jsoref@users.noreply.github.com>

* spelling: environment

Signed-off-by: Josh Soref <jsoref@users.noreply.github.com>

* spelling: equivalent

Signed-off-by: Josh Soref <jsoref@users.noreply.github.com>

* spelling: etsy

Signed-off-by: Josh Soref <jsoref@users.noreply.github.com>

* spelling: everything

Signed-off-by: Josh Soref <jsoref@users.noreply.github.com>

* spelling: examining

Signed-off-by: Josh Soref <jsoref@users.noreply.github.com>

* spelling: expectations

Signed-off-by: Josh Soref <jsoref@users.noreply.github.com>

* spelling: explicit

Signed-off-by: Josh Soref <jsoref@users.noreply.github.com>

* spelling: explicitly

Signed-off-by: Josh Soref <jsoref@users.noreply.github.com>

* spelling: finally

Signed-off-by: Josh Soref <jsoref@users.noreply.github.com>

* spelling: flexible

Signed-off-by: Josh Soref <jsoref@users.noreply.github.com>

* spelling: further

Signed-off-by: Josh Soref <jsoref@users.noreply.github.com>

* spelling: hddtemp

Signed-off-by: Josh Soref <jsoref@users.noreply.github.com>

* spelling: humidity

Signed-off-by: Josh Soref <jsoref@users.noreply.github.com>

* spelling: identify

Signed-off-by: Josh Soref <jsoref@users.noreply.github.com>

* spelling: importance

Signed-off-by: Josh Soref <jsoref@users.noreply.github.com>

* spelling: incoming

Signed-off-by: Josh Soref <jsoref@users.noreply.github.com>

* spelling: individual

Signed-off-by: Josh Soref <jsoref@users.noreply.github.com>

* spelling: initiate

Signed-off-by: Josh Soref <jsoref@users.noreply.github.com>

* spelling: installation

Signed-off-by: Josh Soref <jsoref@users.noreply.github.com>

* spelling: integration

Signed-off-by: Josh Soref <jsoref@users.noreply.github.com>

* spelling: integrity

Signed-off-by: Josh Soref <jsoref@users.noreply.github.com>

* spelling: involuntary

Signed-off-by: Josh Soref <jsoref@users.noreply.github.com>

* spelling: issues

Signed-off-by: Josh Soref <jsoref@users.noreply.github.com>

* spelling: kernel

Signed-off-by: Josh Soref <jsoref@users.noreply.github.com>

* spelling: language

Signed-off-by: Josh Soref <jsoref@users.noreply.github.com>

* spelling: libwebsockets

Signed-off-by: Josh Soref <jsoref@users.noreply.github.com>

* spelling: lighttpd

Signed-off-by: Josh Soref <jsoref@users.noreply.github.com>

* spelling: maintained

Signed-off-by: Josh Soref <jsoref@users.noreply.github.com>

* spelling: meaningful

Signed-off-by: Josh Soref <jsoref@users.noreply.github.com>

* spelling: memory

Signed-off-by: Josh Soref <jsoref@users.noreply.github.com>

* spelling: metrics

Signed-off-by: Josh Soref <jsoref@users.noreply.github.com>

* spelling: miscellaneous

Signed-off-by: Josh Soref <jsoref@users.noreply.github.com>

* spelling: monitoring

Signed-off-by: Josh Soref <jsoref@users.noreply.github.com>

* spelling: monitors

Signed-off-by: Josh Soref <jsoref@users.noreply.github.com>

* spelling: monolithic

Signed-off-by: Josh Soref <jsoref@users.noreply.github.com>

* spelling: multi

Signed-off-by: Josh Soref <jsoref@users.noreply.github.com>

* spelling: multiplier

Signed-off-by: Josh Soref <jsoref@users.noreply.github.com>

* spelling: navigation

Signed-off-by: Josh Soref <jsoref@users.noreply.github.com>

* spelling: noisy

Signed-off-by: Josh Soref <jsoref@users.noreply.github.com>

* spelling: number

Signed-off-by: Josh Soref <jsoref@users.noreply.github.com>

* spelling: observing

Signed-off-by: Josh Soref <jsoref@users.noreply.github.com>

* spelling: omitted

Signed-off-by: Josh Soref <jsoref@users.noreply.github.com>

* spelling: orchestrator

Signed-off-by: Josh Soref <jsoref@users.noreply.github.com>

* spelling: overall

Signed-off-by: Josh Soref <jsoref@users.noreply.github.com>

* spelling: overridden

Signed-off-by: Josh Soref <jsoref@users.noreply.github.com>

* spelling: package

Signed-off-by: Josh Soref <jsoref@users.noreply.github.com>

* spelling: packages

Signed-off-by: Josh Soref <jsoref@users.noreply.github.com>

* spelling: packet

Signed-off-by: Josh Soref <jsoref@users.noreply.github.com>

* spelling: pages

Signed-off-by: Josh Soref <jsoref@users.noreply.github.com>

* spelling: parameter

Signed-off-by: Josh Soref <jsoref@users.noreply.github.com>

* spelling: parsable

Signed-off-by: Josh Soref <jsoref@users.noreply.github.com>

* spelling: percentage

Signed-off-by: Josh Soref <jsoref@users.noreply.github.com>

* spelling: perfect

Signed-off-by: Josh Soref <jsoref@users.noreply.github.com>

* spelling: phpfpm

Signed-off-by: Josh Soref <jsoref@users.noreply.github.com>

* spelling: platform

Signed-off-by: Josh Soref <jsoref@users.noreply.github.com>

* spelling: preferred

Signed-off-by: Josh Soref <jsoref@users.noreply.github.com>

* spelling: prioritize

Signed-off-by: Josh Soref <jsoref@users.noreply.github.com>

* spelling: probabilities

Signed-off-by: Josh Soref <jsoref@users.noreply.github.com>

* spelling: process

Signed-off-by: Josh Soref <jsoref@users.noreply.github.com>

* spelling: processes

Signed-off-by: Josh Soref <jsoref@users.noreply.github.com>

* spelling: program

Signed-off-by: Josh Soref <jsoref@users.noreply.github.com>

* spelling: qos

Signed-off-by: Josh Soref <jsoref@users.noreply.github.com>

* spelling: quick

Signed-off-by: Josh Soref <jsoref@users.noreply.github.com>

* spelling: raspberry

Signed-off-by: Josh Soref <jsoref@users.noreply.github.com>

* spelling: received

Signed-off-by: Josh Soref <jsoref@users.noreply.github.com>

* spelling: recvfile

Signed-off-by: Josh Soref <jsoref@users.noreply.github.com>

* spelling: red hat

Signed-off-by: Josh Soref <jsoref@users.noreply.github.com>

* spelling: relatively

Signed-off-by: Josh Soref <jsoref@users.noreply.github.com>

* spelling: reliability

Signed-off-by: Josh Soref <jsoref@users.noreply.github.com>

* spelling: repository

Signed-off-by: Josh Soref <jsoref@users.noreply.github.com>

* spelling: requested

Signed-off-by: Josh Soref <jsoref@users.noreply.github.com>

* spelling: requests

Signed-off-by: Josh Soref <jsoref@users.noreply.github.com>

* spelling: retrieved

Signed-off-by: Josh Soref <jsoref@users.noreply.github.com>

* spelling: scenarios

Signed-off-by: Josh Soref <jsoref@users.noreply.github.com>

* spelling: see all

Signed-off-by: Josh Soref <jsoref@users.noreply.github.com>

* spelling: supported

Signed-off-by: Josh Soref <jsoref@users.noreply.github.com>

* spelling: supports

Signed-off-by: Josh Soref <jsoref@users.noreply.github.com>

* spelling: temporary

Signed-off-by: Josh Soref <jsoref@users.noreply.github.com>

* spelling: tsdb

Signed-off-by: Josh Soref <jsoref@users.noreply.github.com>

* spelling: tutorial

Signed-off-by: Josh Soref <jsoref@users.noreply.github.com>

* spelling: updates

Signed-off-by: Josh Soref <jsoref@users.noreply.github.com>

* spelling: utilization

Signed-off-by: Josh Soref <jsoref@users.noreply.github.com>

* spelling: value

Signed-off-by: Josh Soref <jsoref@users.noreply.github.com>

* spelling: variables

Signed-off-by: Josh Soref <jsoref@users.noreply.github.com>

* spelling: visualize

Signed-off-by: Josh Soref <jsoref@users.noreply.github.com>

* spelling: voluntary

Signed-off-by: Josh Soref <jsoref@users.noreply.github.com>

* spelling: your

Signed-off-by: Josh Soref <jsoref@users.noreply.github.com>
278 lines
17 KiB
Markdown
278 lines
17 KiB
Markdown
<!--
|
|
title: "Monitor a Kubernetes (k8s) cluster with Netdata"
|
|
description: "Use Netdata's helmchart, service discovery plugin, and Kubelet/kube-proxy collectors for real-time visibility into your Kubernetes cluster."
|
|
image: /img/seo/guides/monitor/kubernetes-k8s-netdata.png
|
|
custom_edit_url: https://github.com/netdata/netdata/edit/master/docs/guides/monitor/kubernetes-k8s-netdata.md
|
|
-->
|
|
|
|
# Monitor a Kubernetes cluster with Netdata
|
|
|
|
While Kubernetes (k8s) might simplify the way you deploy, scale, and load-balance your applications, not all clusters
|
|
come with "batteries included" when it comes to monitoring. Doubly so for a monitoring stack that helps you actively
|
|
troubleshoot issues with your cluster.
|
|
|
|
Some k8s providers, like GKE (Google Kubernetes Engine), do deploy clusters bundled with monitoring capabilities, such
|
|
as Google Stackdriver Monitoring. However, these pre-configured solutions might not offer the depth of metrics,
|
|
customization, or integration with your preferred alerting methods.
|
|
|
|
Without this visibility, it's like you built an entire house and _then_ smashed your way through the finished walls to
|
|
add windows.
|
|
|
|
At Netdata, we're working to build Kubernetes monitoring tools that add visibility without complexity while also helping
|
|
you actively troubleshoot anomalies or outages. Better yet, this toolkit includes a few complementary collectors that
|
|
let you monitor the many layers of a Kubernetes cluster entirely for free.
|
|
|
|
We already have a few complementary tools and collectors for monitoring the many layers of a Kubernetes cluster,
|
|
_entirely for free_. These methods work together to help you troubleshoot performance or availability issues across
|
|
your k8s infrastructure.
|
|
|
|
- A [Helm chart](https://github.com/netdata/helmchart), which bootstraps a Netdata Agent pod on every node in your
|
|
cluster, plus an additional parent pod for storing metrics and managing alarm notifications.
|
|
- A [service discovery plugin](https://github.com/netdata/agent-service-discovery), which discovers and creates
|
|
configuration files for [compatible
|
|
applications](https://github.com/netdata/helmchart#service-discovery-and-supported-services) and any endpoints
|
|
covered by our [generic Prometheus
|
|
collector](https://learn.netdata.cloud/docs/agent/collectors/go.d.plugin/modules/prometheus). With these
|
|
configuration files, Netdata collects metrics from any compatible applications as they run _inside_ of a pod.
|
|
Service discovery happens without manual intervention as pods are created, destroyed, or moved between nodes.
|
|
- A [Kubelet collector](https://learn.netdata.cloud/docs/agent/collectors/go.d.plugin/modules/k8s_kubelet), which runs
|
|
on each node in a k8s cluster to monitor the number of pods/containers, the volume of operations on each container,
|
|
and more.
|
|
- A [kube-proxy collector](https://learn.netdata.cloud/docs/agent/collectors/go.d.plugin/modules/k8s_kubeproxy), which
|
|
also runs on each node and monitors latency and the volume of HTTP requests to the proxy.
|
|
- A [cgroups collector](/collectors/cgroups.plugin/README.md), which collects CPU, memory, and bandwidth metrics for
|
|
each container running on your k8s cluster.
|
|
|
|
By following this guide, you'll learn how to discover, explore, and take away insights from each of these layers in your
|
|
Kubernetes cluster. Let's get started.
|
|
|
|
## Prerequisites
|
|
|
|
To follow this guide, you need:
|
|
|
|
- A working cluster running Kubernetes v1.9 or newer.
|
|
- The [kubectl](https://kubernetes.io/docs/reference/kubectl/overview/) command line tool, within [one minor version
|
|
difference](https://kubernetes.io/docs/tasks/tools/install-kubectl/#before-you-begin) of your cluster, on an
|
|
administrative system.
|
|
- The [Helm package manager](https://helm.sh/) v3.0.0 or newer on the same administrative system.
|
|
|
|
**You need to install the Netdata Helm chart on your cluster** before you proceed. See our [Kubernetes installation
|
|
process](/packaging/installer/methods/kubernetes.md) for details.
|
|
|
|
This guide uses a 3-node cluster, running on Digital Ocean, as an example. This cluster runs CockroachDB, Redis, and
|
|
Apache, which we'll use as examples of how to monitor a Kubernetes cluster with Netdata.
|
|
|
|
```bash
|
|
kubectl get nodes
|
|
NAME STATUS ROLES AGE VERSION
|
|
pool-0z7557lfb-3fnbf Ready <none> 51m v1.17.5
|
|
pool-0z7557lfb-3fnbx Ready <none> 51m v1.17.5
|
|
pool-0z7557lfb-3fnby Ready <none> 51m v1.17.5
|
|
|
|
kubectl get pods
|
|
NAME READY STATUS RESTARTS AGE
|
|
cockroachdb-0 1/1 Running 0 44h
|
|
cockroachdb-1 1/1 Running 0 44h
|
|
cockroachdb-2 1/1 Running 1 44h
|
|
cockroachdb-init-q7mp6 0/1 Completed 0 44h
|
|
httpd-6f6cb96d77-4zlc9 1/1 Running 0 2m47s
|
|
httpd-6f6cb96d77-d9gs6 1/1 Running 0 2m47s
|
|
httpd-6f6cb96d77-xtpwn 1/1 Running 0 11m
|
|
netdata-child-5p2m9 2/2 Running 0 42h
|
|
netdata-child-92qvf 2/2 Running 0 42h
|
|
netdata-child-djc6w 2/2 Running 0 42h
|
|
netdata-parent-0 1/1 Running 0 42h
|
|
redis-6bb94d4689-6nn6v 1/1 Running 0 73s
|
|
redis-6bb94d4689-c2fk2 1/1 Running 0 73s
|
|
redis-6bb94d4689-tjcz5 1/1 Running 0 88s
|
|
```
|
|
|
|
## Explore Netdata's Kubernetes charts
|
|
|
|
The Helm chart installs and enables everything you need for visibility into your k8s cluster, including the service
|
|
discovery plugin, Kubelet collector, kube-proxy collector, and cgroups collector.
|
|
|
|
To get started, open your browser and navigate to your cluster's Netdata dashboard. See our [Kubernetes installation
|
|
instructions](/packaging/installer/methods/kubernetes.md) for how to access the dashboard based on your cluster's
|
|
configuration.
|
|
|
|
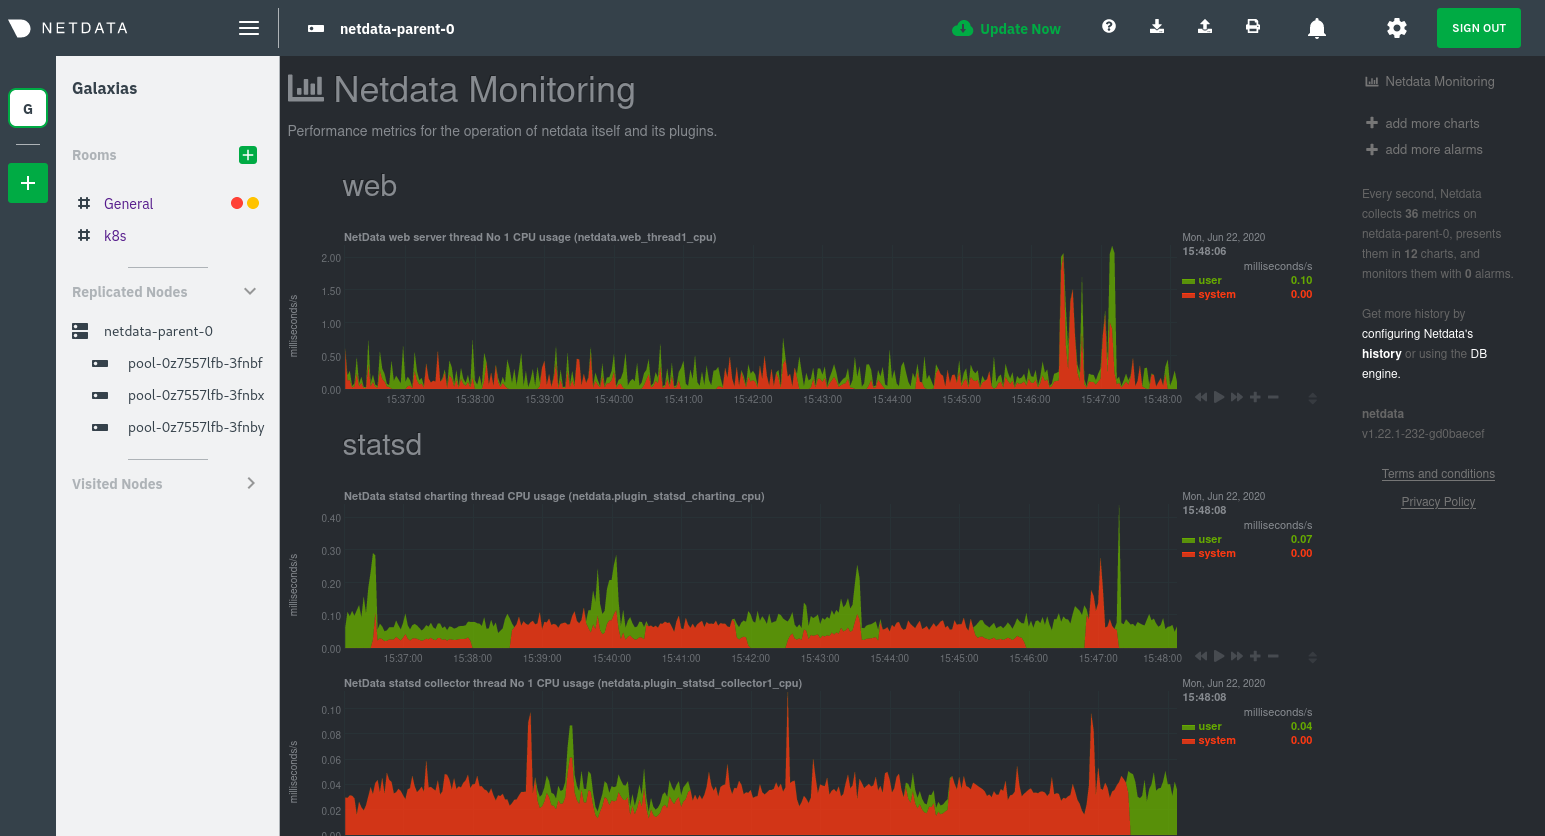
You'll see metrics from the parent pod as soon as you navigate to the dashboard:
|
|
|
|
|
|
|
|
Remember that the parent pod is responsible for storing metrics from all the child pods and sending alarms.
|
|
|
|
Take note of the **Replicated Nodes** menu, which shows not only the parent pod, but also the three child pods. This
|
|
example cluster has three child pods, but the number of child pods depends entirely on the number of nodes in your
|
|
cluster.
|
|
|
|
You'll use the links in the **Replicated Nodes** menu to navigate between the various pods in your cluster. Let's do
|
|
that now to explore the pod-level Kubernetes monitoring Netdata delivers.
|
|
|
|
### Pods
|
|
|
|
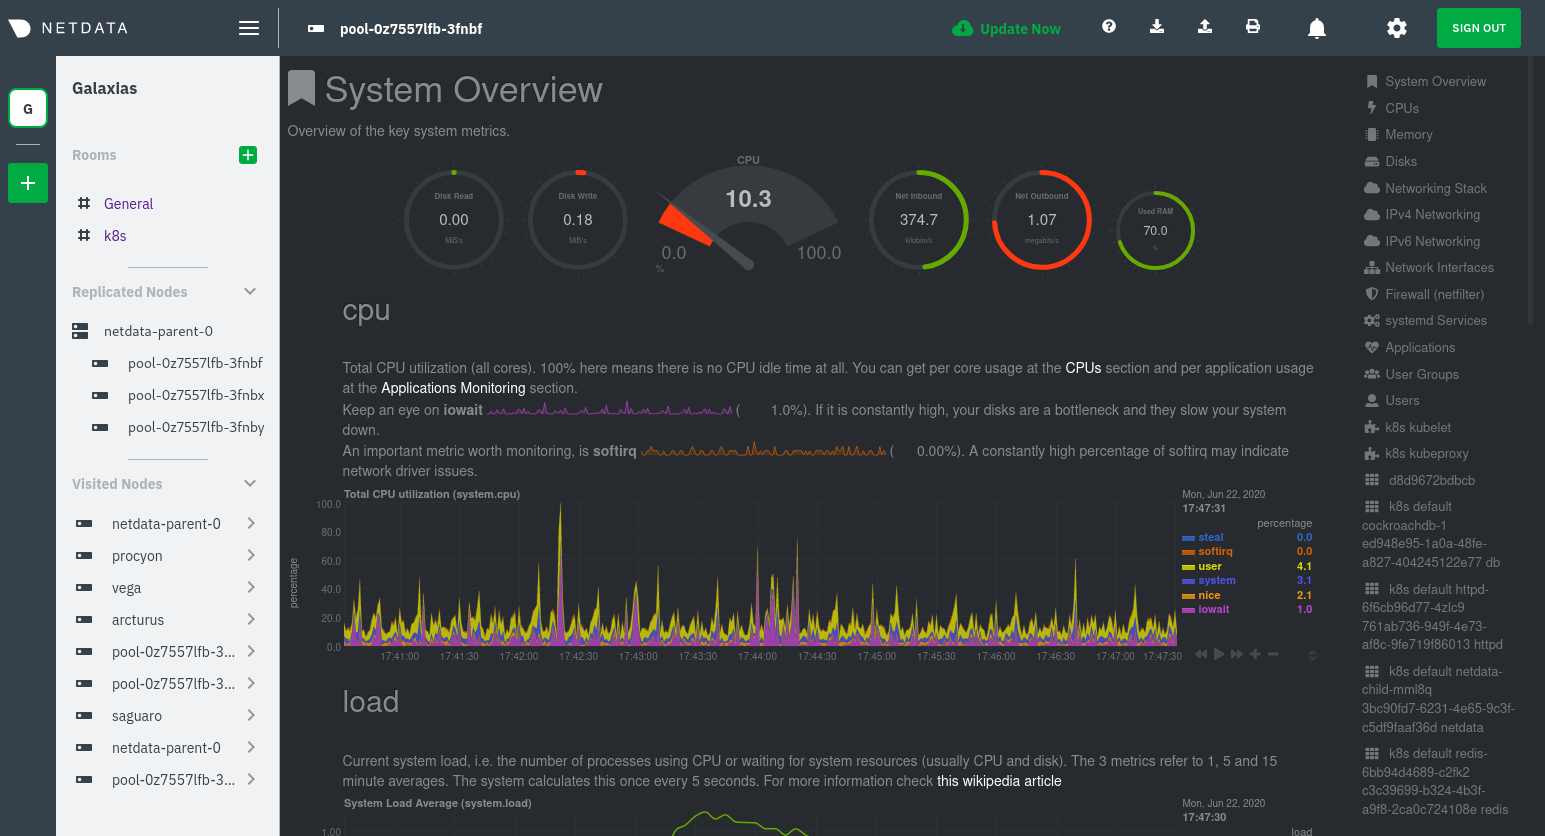
Click on any of the nodes under **netdata-parent-0**. Netdata redirects you to a separate instance of the Netdata
|
|
dashboard, run by the Netdata child pod, which visualizes thousands of metrics from that node.
|
|
|
|
|
|
|
|
From this dashboard, you can see all the familiar charts showing the health and performance of an individual node, just
|
|
like you would if you installed Netdata on a single physical system. Explore CPU, memory, bandwidth, networking, and
|
|
more.
|
|
|
|
You can use the menus on the right-hand side of the dashboard to navigate between different sections of charts and
|
|
metrics.
|
|
|
|
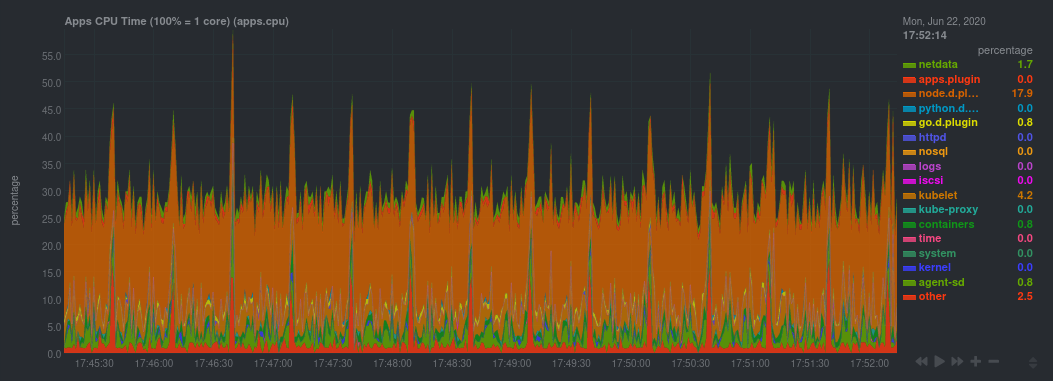
For example, click on the **Applications** section to view per-application metrics, collected by
|
|
[apps.plugin](/collectors/apps.plugin/README.md). The first chart you see is **Apps CPU Time (100% = 1 core)
|
|
(apps.cpu)**, which shows the CPU utilization of various applications running on the node. You shouldn't be surprised to
|
|
find Netdata processes (`netdata`, `sd-agent`, and more) alongside Kubernetes processes (`kubelet`, `kube-proxy`, and
|
|
`containers`).
|
|
|
|
|
|
|
|
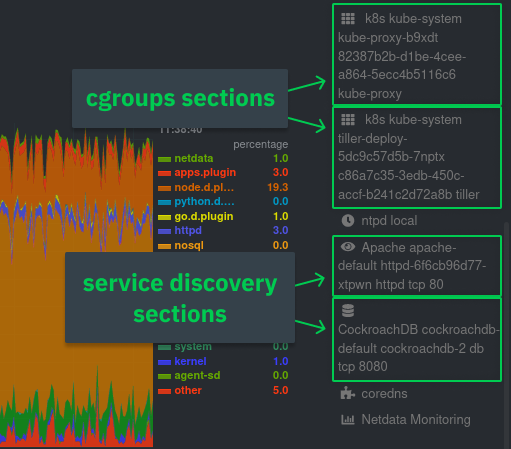
Beneath the **Applications** section, you'll begin to see sections for **k8s kubelet**, **k8s kubeproxy**, and long
|
|
strings that start with **k8s**, which are sections for metrics collected by
|
|
[`cgroups.plugin`](/collectors/cgroups.plugin/README.md). Let's skip over those for now and head further down to see
|
|
Netdata's service discovery in action.
|
|
|
|
### Service discovery (services running inside of pods)
|
|
|
|
Thanks to Netdata's service discovery feature, you monitor containerized applications running in k8s pods with zero
|
|
configuration or manual intervention. Service discovery is like a watchdog for created or deleted pods, recognizing the
|
|
service they run based on the image name and port and immediately attempting to apply a logical default configuration.
|
|
|
|
Service configuration supports [popular
|
|
applications](https://github.com/netdata/helmchart#service-discovery-and-supported-services), plus any endpoints covered
|
|
by our [generic Prometheus collector](https://learn.netdata.cloud/docs/agent/collectors/go.d.plugin/modules/prometheus),
|
|
which are automatically added or removed from Netdata as soon as the pods are created or destroyed.
|
|
|
|
You can find these service discovery sections near the bottom of the menu. The names for these sections follow a
|
|
pattern: the name of the detected service, followed by a string of the module name, pod TUID, service type, port
|
|
protocol, and port number. See the graphic below to help you identify service discovery sections.
|
|
|
|
|
|
|
|
For example, the first service discovery section shows metrics for a pod running an Apache web server running on port 80
|
|
in a pod named `httpd-6f6cb96d77-xtpwn`.
|
|
|
|
> If you don't see any service discovery sections, it's either because your services are not compatible with service
|
|
> discovery or you changed their default configuration, such as the listening port. See the [list of supported
|
|
> services](https://github.com/netdata/helmchart#service-discovery-and-supported-services) for details about whether
|
|
> your installed services are compatible with service discovery, or read the [configuration
|
|
> instructions](/packaging/installer/methods/kubernetes.md#configure-service-discovery) to change how it discovers the
|
|
> supported services.
|
|
|
|
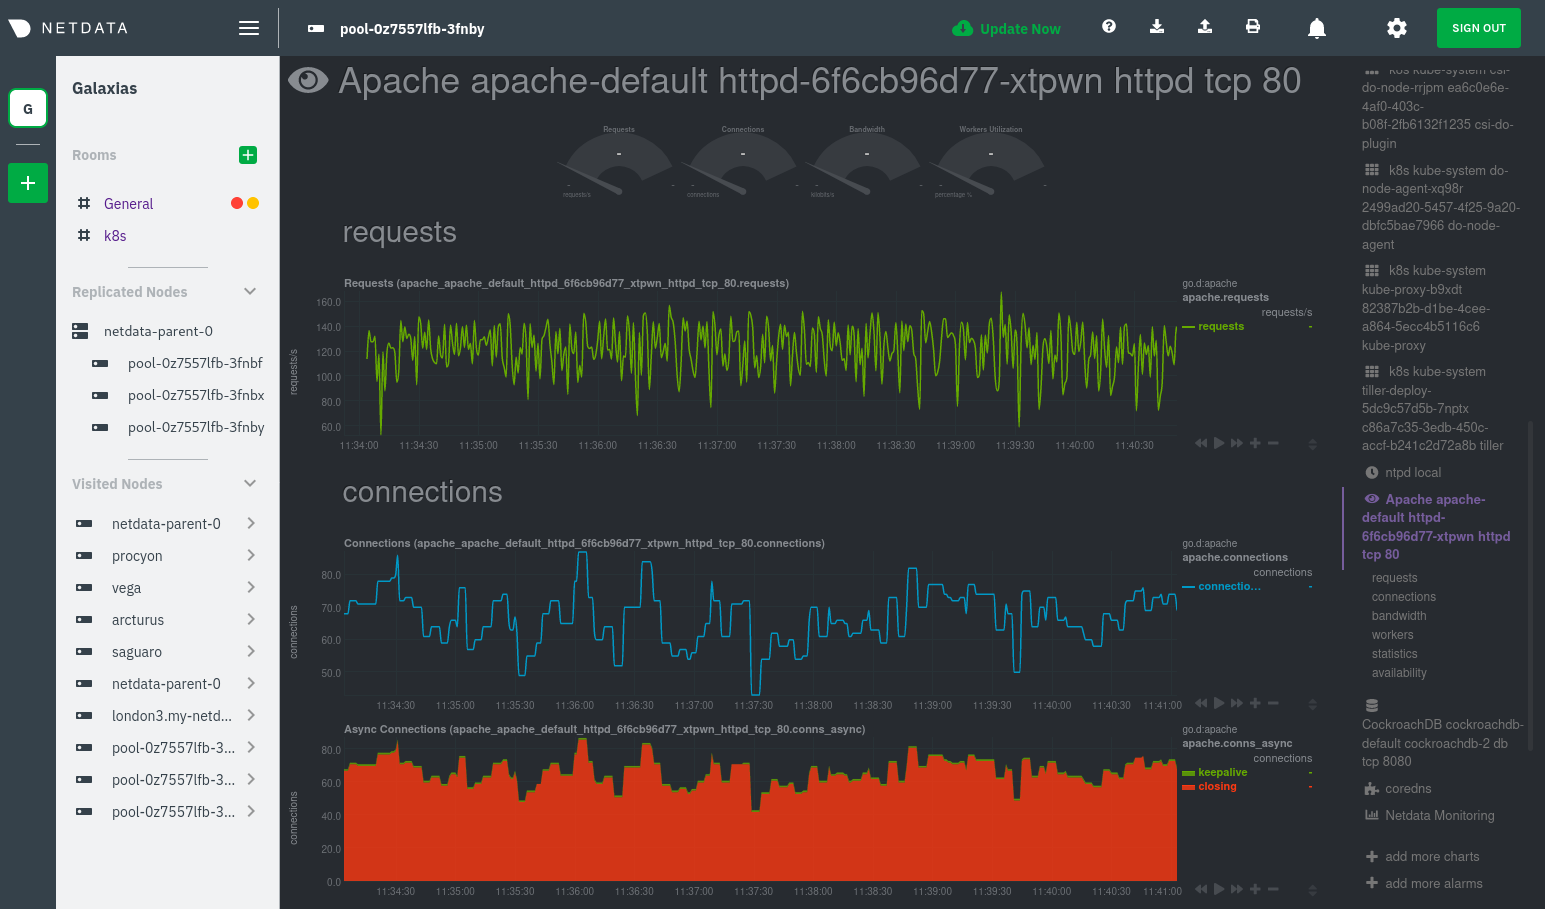
Click on any of these service discovery sections to see metrics from that particular service. For example, click on the
|
|
**Apache apache-default httpd-6f6cb96d77-xtpwn httpd tcp 80** section brings you to a series of charts populated by the
|
|
[Apache collector](https://learn.netdata.cloud/docs/agent/collectors/go.d.plugin/modules/apache) itself.
|
|
|
|
With service discovery, you can now see valuable metrics like requests, bandwidth, workers, and more for this pod.
|
|
|
|
|
|
|
|
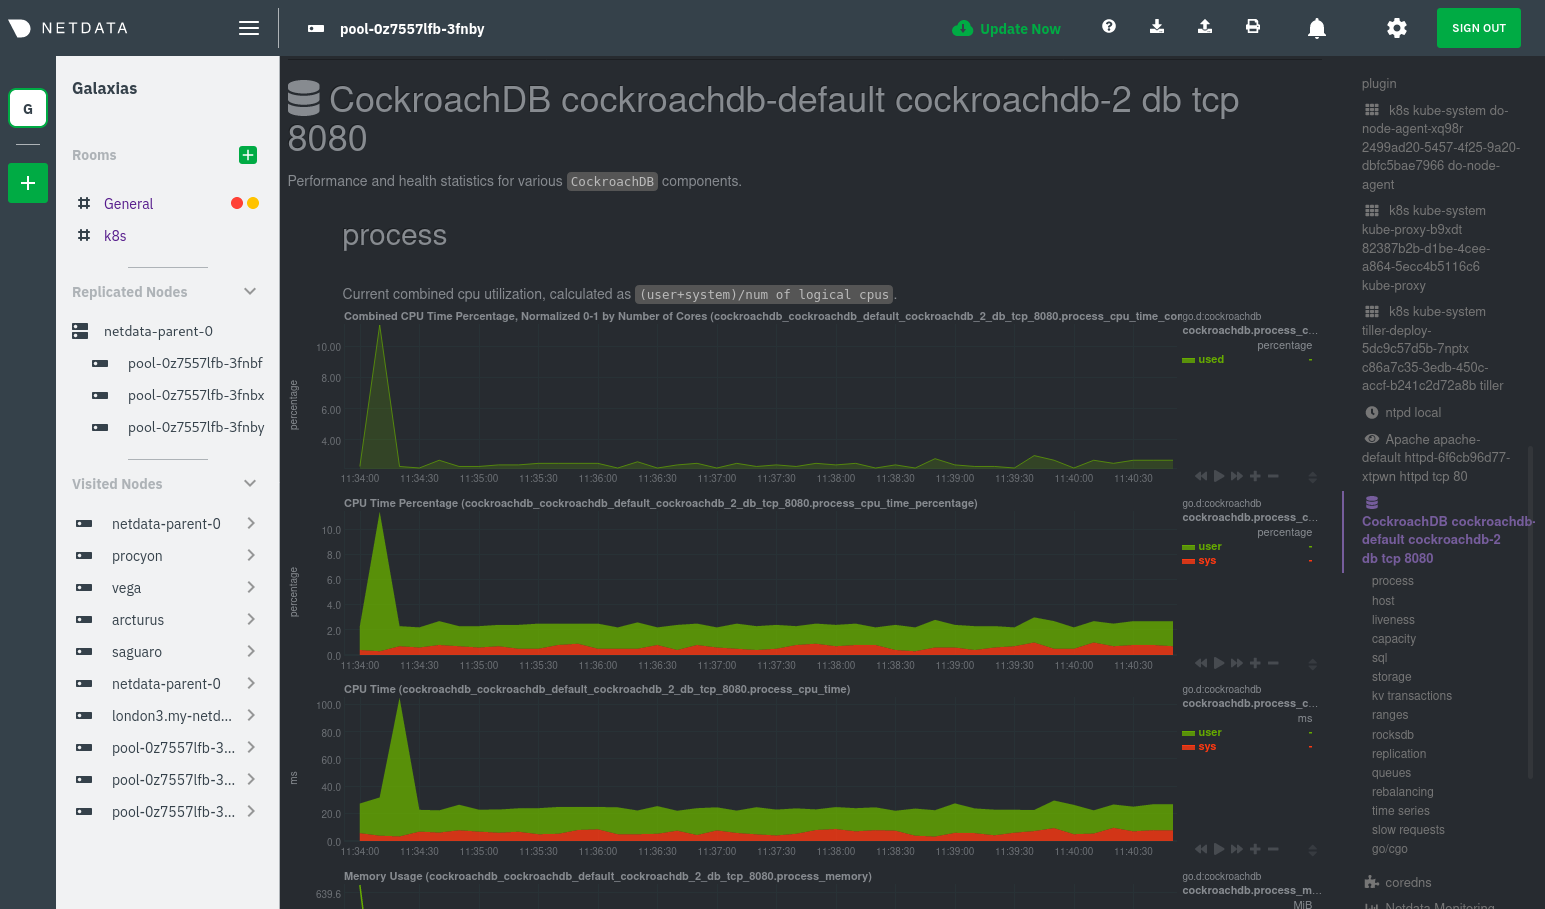
The same goes for metrics coming from the CockroachDB pod running on this same node.
|
|
|
|
|
|
|
|
Service discovery helps you monitor the health of specific applications running on your Kubernetes cluster, which in
|
|
turn gives you a complete resource when troubleshooting your infrastructure's health and performance.
|
|
|
|
### Kubelet
|
|
|
|
Let's head back up the menu to the **k8s kubelet** section. Kubelet is an agent that runs on every node in a cluster. It
|
|
receives a set of PodSpecs from the Kubernetes Control Plane and ensures the pods described there are both running and
|
|
healthy. Think of it as a manager for the various pods on that node.
|
|
|
|
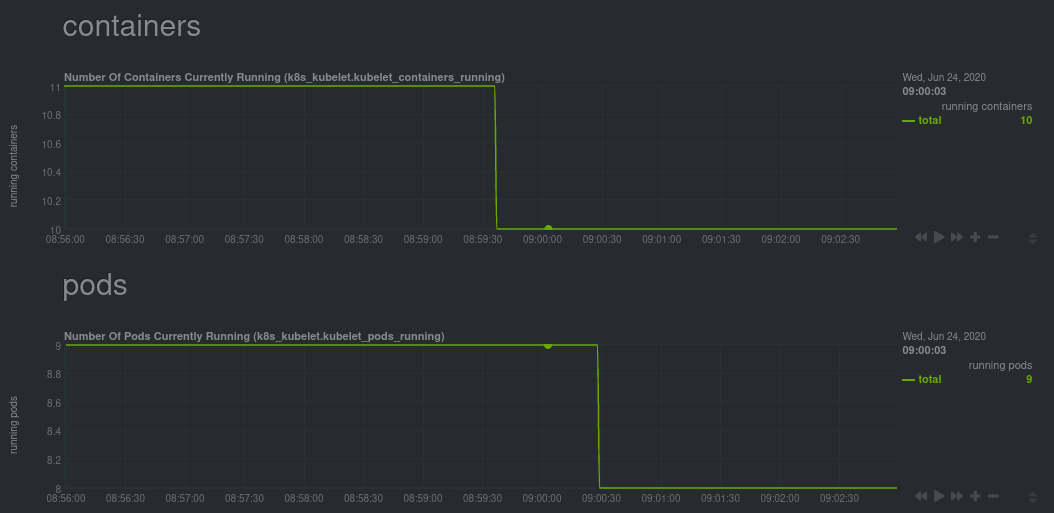
Monitoring each node's Kubelet can be invaluable when diagnosing issues with your Kubernetes cluster. For example, you
|
|
can see when the volume of running containers/pods has dropped.
|
|
|
|
|
|
|
|
This drop might signal a fault or crash in a particular Kubernetes service or deployment (see `kubectl get services` or
|
|
`kubectl get deployments` for more details). If the number of pods increases, it may be because of something more
|
|
benign, like another member of your team scaling up a service with `kubectl scale`.
|
|
|
|
You can also view charts for the Kubelet API server, the volume of runtime/Docker operations by type,
|
|
configuration-related errors, and the actual vs. desired numbers of volumes, plus a lot more.
|
|
|
|
Kubelet metrics are collected and visualized thanks to the [kubelet
|
|
collector](https://learn.netdata.cloud/docs/agent/collectors/go.d.plugin/modules/k8s_kubelet), which is enabled with
|
|
zero configuration on most Kubernetes clusters with standard configurations.
|
|
|
|
### kube-proxy
|
|
|
|
Scroll down into the **k8s kubeproxy** section to see metrics about the network proxy that runs on each node in your
|
|
Kubernetes cluster. kube-proxy allows for pods to communicate with each other and accept sessions from outside your
|
|
cluster.
|
|
|
|
With Netdata, you can monitor how often your k8s proxies are syncing proxy rules between nodes. Dramatic changes in
|
|
these figures could indicate an anomaly in your cluster that's worthy of further investigation.
|
|
|
|
kube-proxy metrics are collected and visualized thanks to the [kube-proxy
|
|
collector](https://learn.netdata.cloud/docs/agent/collectors/go.d.plugin/modules/k8s_kubeproxy), which is enabled with
|
|
zero configuration on most Kubernetes clusters with standard configurations.
|
|
|
|
### Containers
|
|
|
|
We can finally talk about the final piece of Kubernetes monitoring: containers. Each Kubernetes pod is a set of one or
|
|
more cooperating containers, sharing the same namespace, all of which are resourced and tracked by the cgroups feature
|
|
of the Linux kernel. Netdata automatically detects and monitors each running container by interfacing with the cgroups
|
|
feature itself.
|
|
|
|
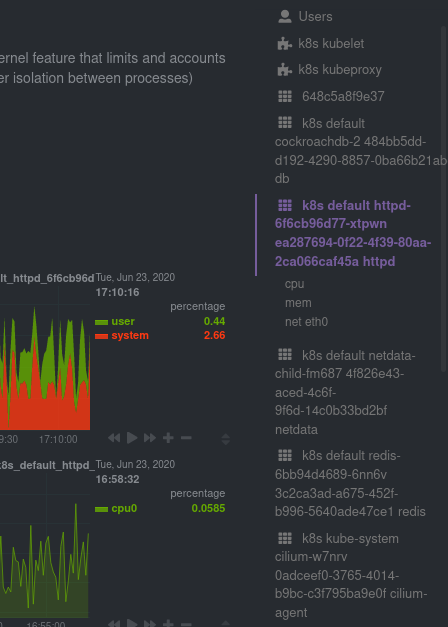
You can find these sections beneath **Users**, **k8s kubelet**, and **k8s kubeproxy**. Below, a number of containers
|
|
devoted to running services like CockroachDB, Apache, Redis, and more.
|
|
|
|
|
|
|
|
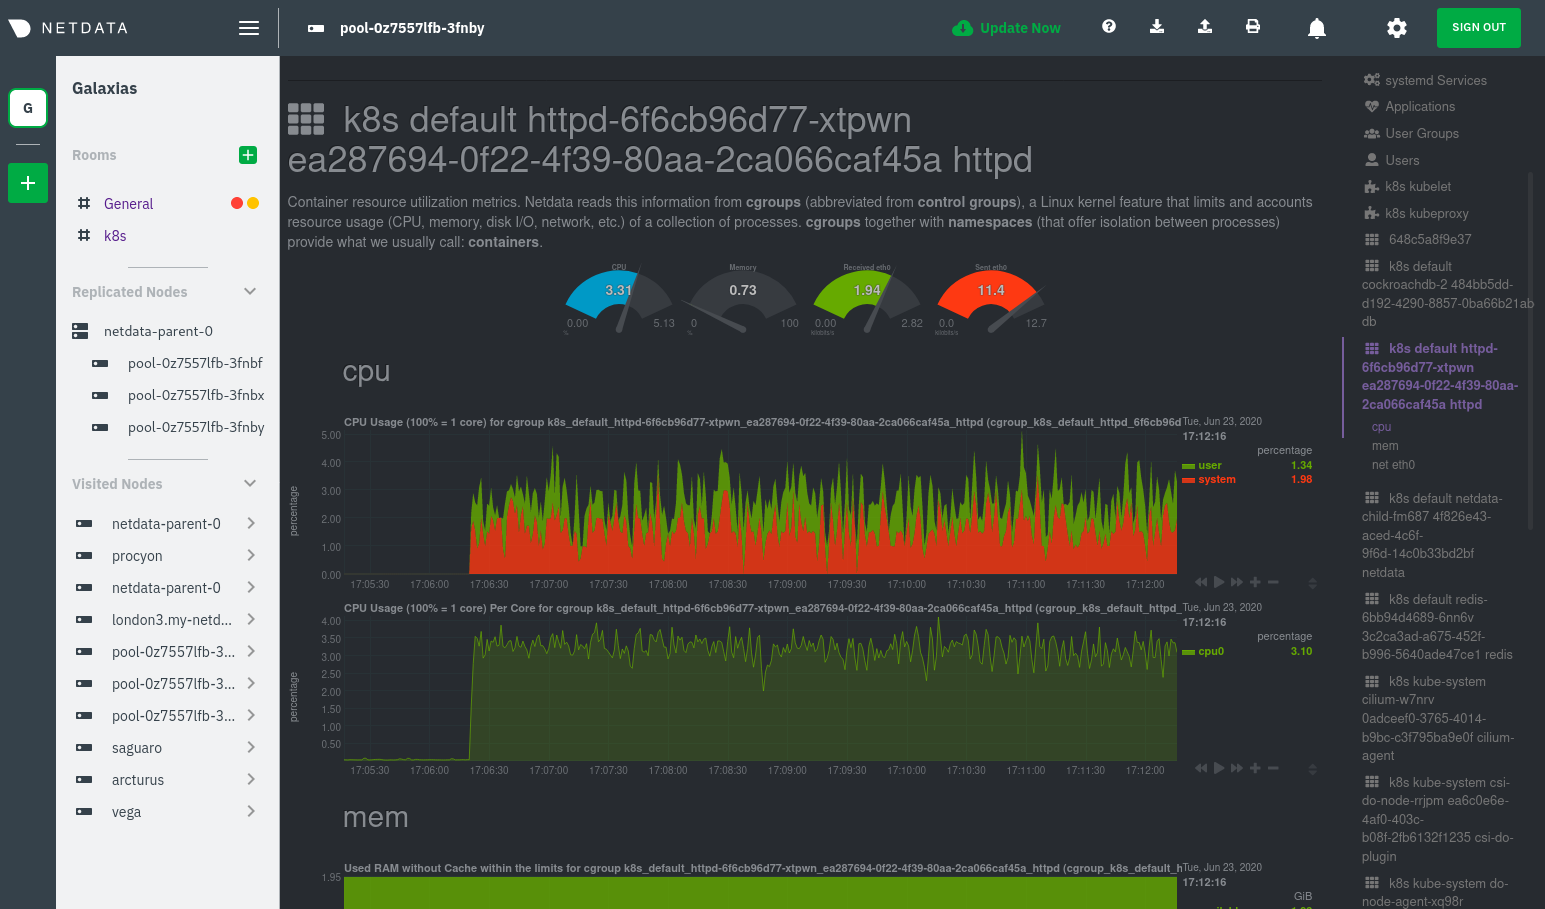
Let's look at the section devoted to the container that runs the Apache pod named `httpd-6f6cb96d77-xtpwn`, as described
|
|
in the previous part on [service discovery](#service-discovery-services-running-inside-of-pods).
|
|
|
|
|
|
|
|
At first glance, these sections might seem redundant. You might ask, "Why do I need both a service discovery section
|
|
_and_ a container section? It's just one pod, after all!"
|
|
|
|
The difference is that while the service discovery section shows _Apache_ metrics, the equivalent cgroups section shows
|
|
that container's CPU, memory, and bandwidth usage. You can use the two sections in conjunction to monitor the health and
|
|
performance of your pods and the services they run.
|
|
|
|
For example, let's say you get an alarm notification from `netdata-parent-0` saying the
|
|
`ea287694-0f22-4f39-80aa-2ca066caf45a` container (also known as the `httpd-6f6cb96d77-xtpwn` pod) is using 99% of its
|
|
available RAM. You can then hop over to the **Apache apache-default httpd-6f6cb96d77-xtpwn httpd tcp 80** section to
|
|
further investigate why Apache is using an unexpected amount of RAM.
|
|
|
|
All container metrics, whether they're managed by Kubernetes or the Docker service directly, are collected by the
|
|
[cgroups collector](/collectors/cgroups.plugin/README.md). Because this collector integrates with the cgroups Linux
|
|
kernel feature itself, monitoring containers requires zero configuration on most Kubernetes clusters.
|
|
|
|
## What's next?
|
|
|
|
After following this guide, you should have a more comprehensive understanding of how to monitor your Kubernetes cluster
|
|
with Netdata. With this setup, you can monitor the health and performance of all your nodes, pods, services, and k8s
|
|
agents. Pre-configured alarms will tell you when something goes awry, and this setup gives you every per-second metric
|
|
you need to make informed decisions about your cluster.
|
|
|
|
The best part of monitoring a Kubernetes cluster with Netdata is that you don't have to worry about constantly running
|
|
complex `kubectl` commands to see hundreds of highly granular metrics from your nodes. And forget about using `kubectl
|
|
exec -it pod bash` to start up a shell on a pod to find and diagnose an issue with any given pod on your cluster.
|
|
|
|
And with service discovery, all your compatible pods will automatically appear and disappear as they scale up, move, or
|
|
scale down across your cluster.
|
|
|
|
To monitor your Kubernetes cluster with Netdata, start by [installing the Helm
|
|
chart](/packaging/installer/methods/kubernetes.md) if you haven't already. The Netdata Agent is open source and entirely
|
|
free for every cluster and every organization, whether you have 10 or 10,000 pods. A few minutes and one `helm install`
|
|
later and you'll have started on the path of building an effective platform for troubleshooting the next performance or
|
|
availability issue on your Kubernetes cluster.
|
|
|
|
[](<>)
|